Trading_and_investment_papers plus Daily Shot when available.
Window PDFs15
Chart Extracts44
Top Charts6
Daily Shotskipped
Bottom line: This packet is the one-stop morning read: curated chart evidence first, Daily Shot context second, and source links at the end.
Top Charts
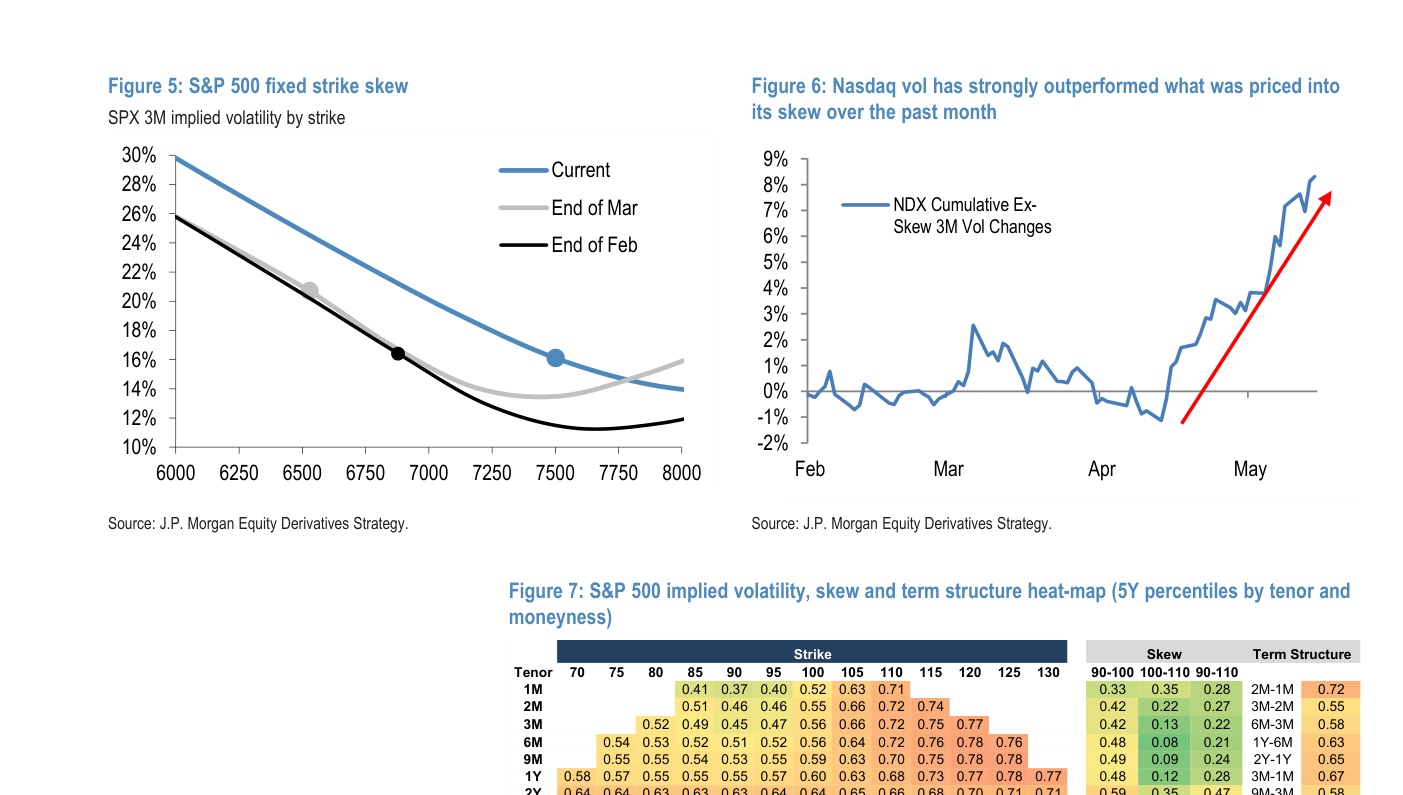
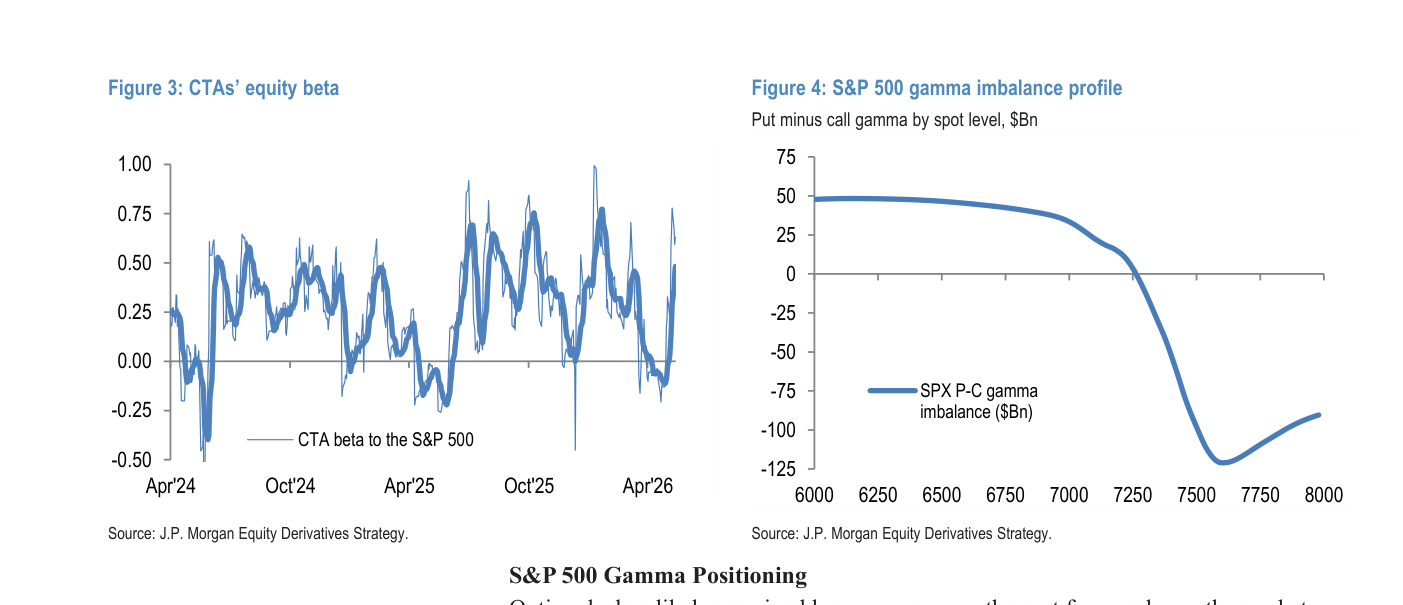
1. JPM US Equity Derivatives Strategy Tactical Upside Trades in AMZN: Options are shaping the path of the underlying
Page 4 | JPM US Equity Derivatives Strategy Tactical Upside Trades in AMZN
What it says: JPM US Equity Derivatives Strategy Tactical Upside Trades in AMZN: Figure 5: S&P 500 fixed strike skew SPX 3M implied volatility by strike 10% 12% 14% 16% 18% 20% 22% 24% 26% 28% 30% 6000 6250 6500 6750 7000 7250 7500 7750 8000 Current End of Mar End of Feb Source: J.P. Morgan Equity Derivatives Strategy. Figure 6: Nasdaq...
Worldview update: The rally has become more flow-mechanical. Fundamentals still matter, but call demand, vol compression, and dealer positioning are first-order timing variables.
Portfolio/use: Favor defined-risk upside and start adding downside while hedges are ignored.
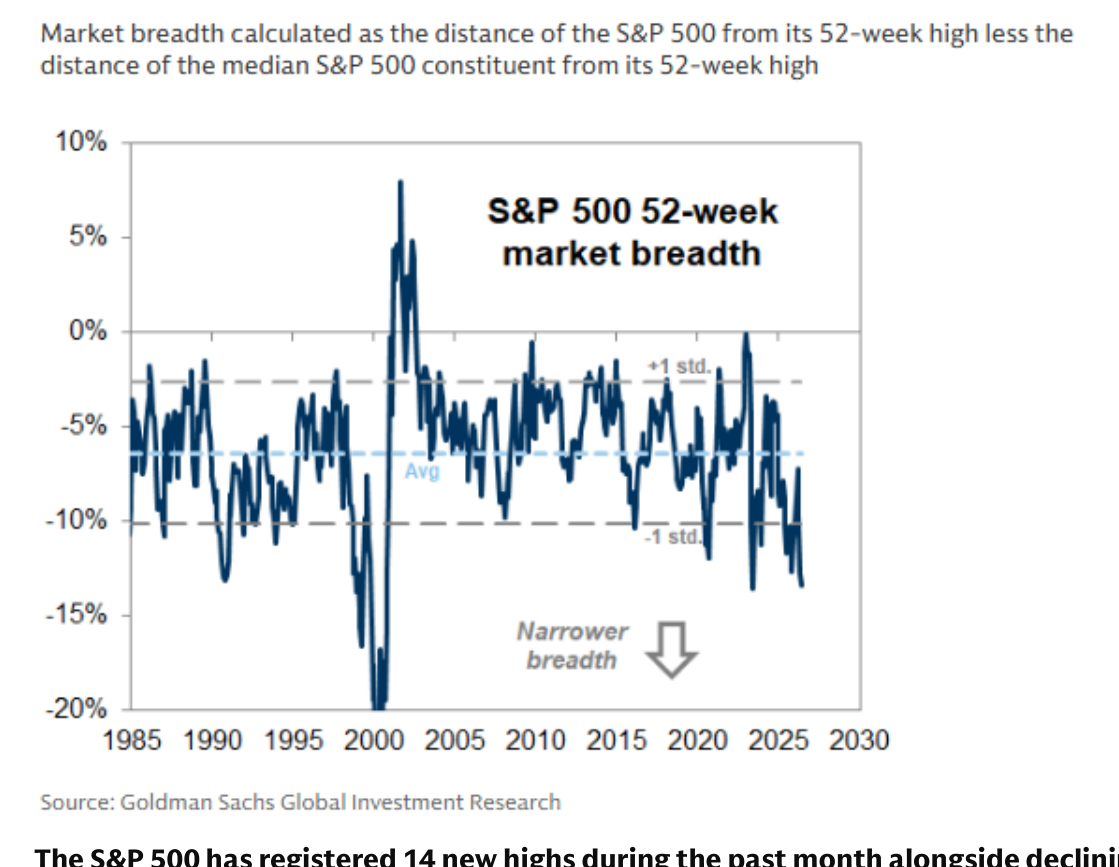
2. Eq Positioning and Key Levels: Breadth is narrowing beneath the index
Page 12 | Eq Positioning and Key Levels
What it says: Eq Positioning and Key Levels: The S&P 500 has registered 14 new highs during the past month alongside declining market breadth.
Worldview update: SPX strength is increasingly an index-concentration signal. The macro read from headline index levels is polluted by a few large leaders.
Portfolio/use: Separate SPX direction from equal-weight health; prefer relative-value hedges over blunt index shorts.
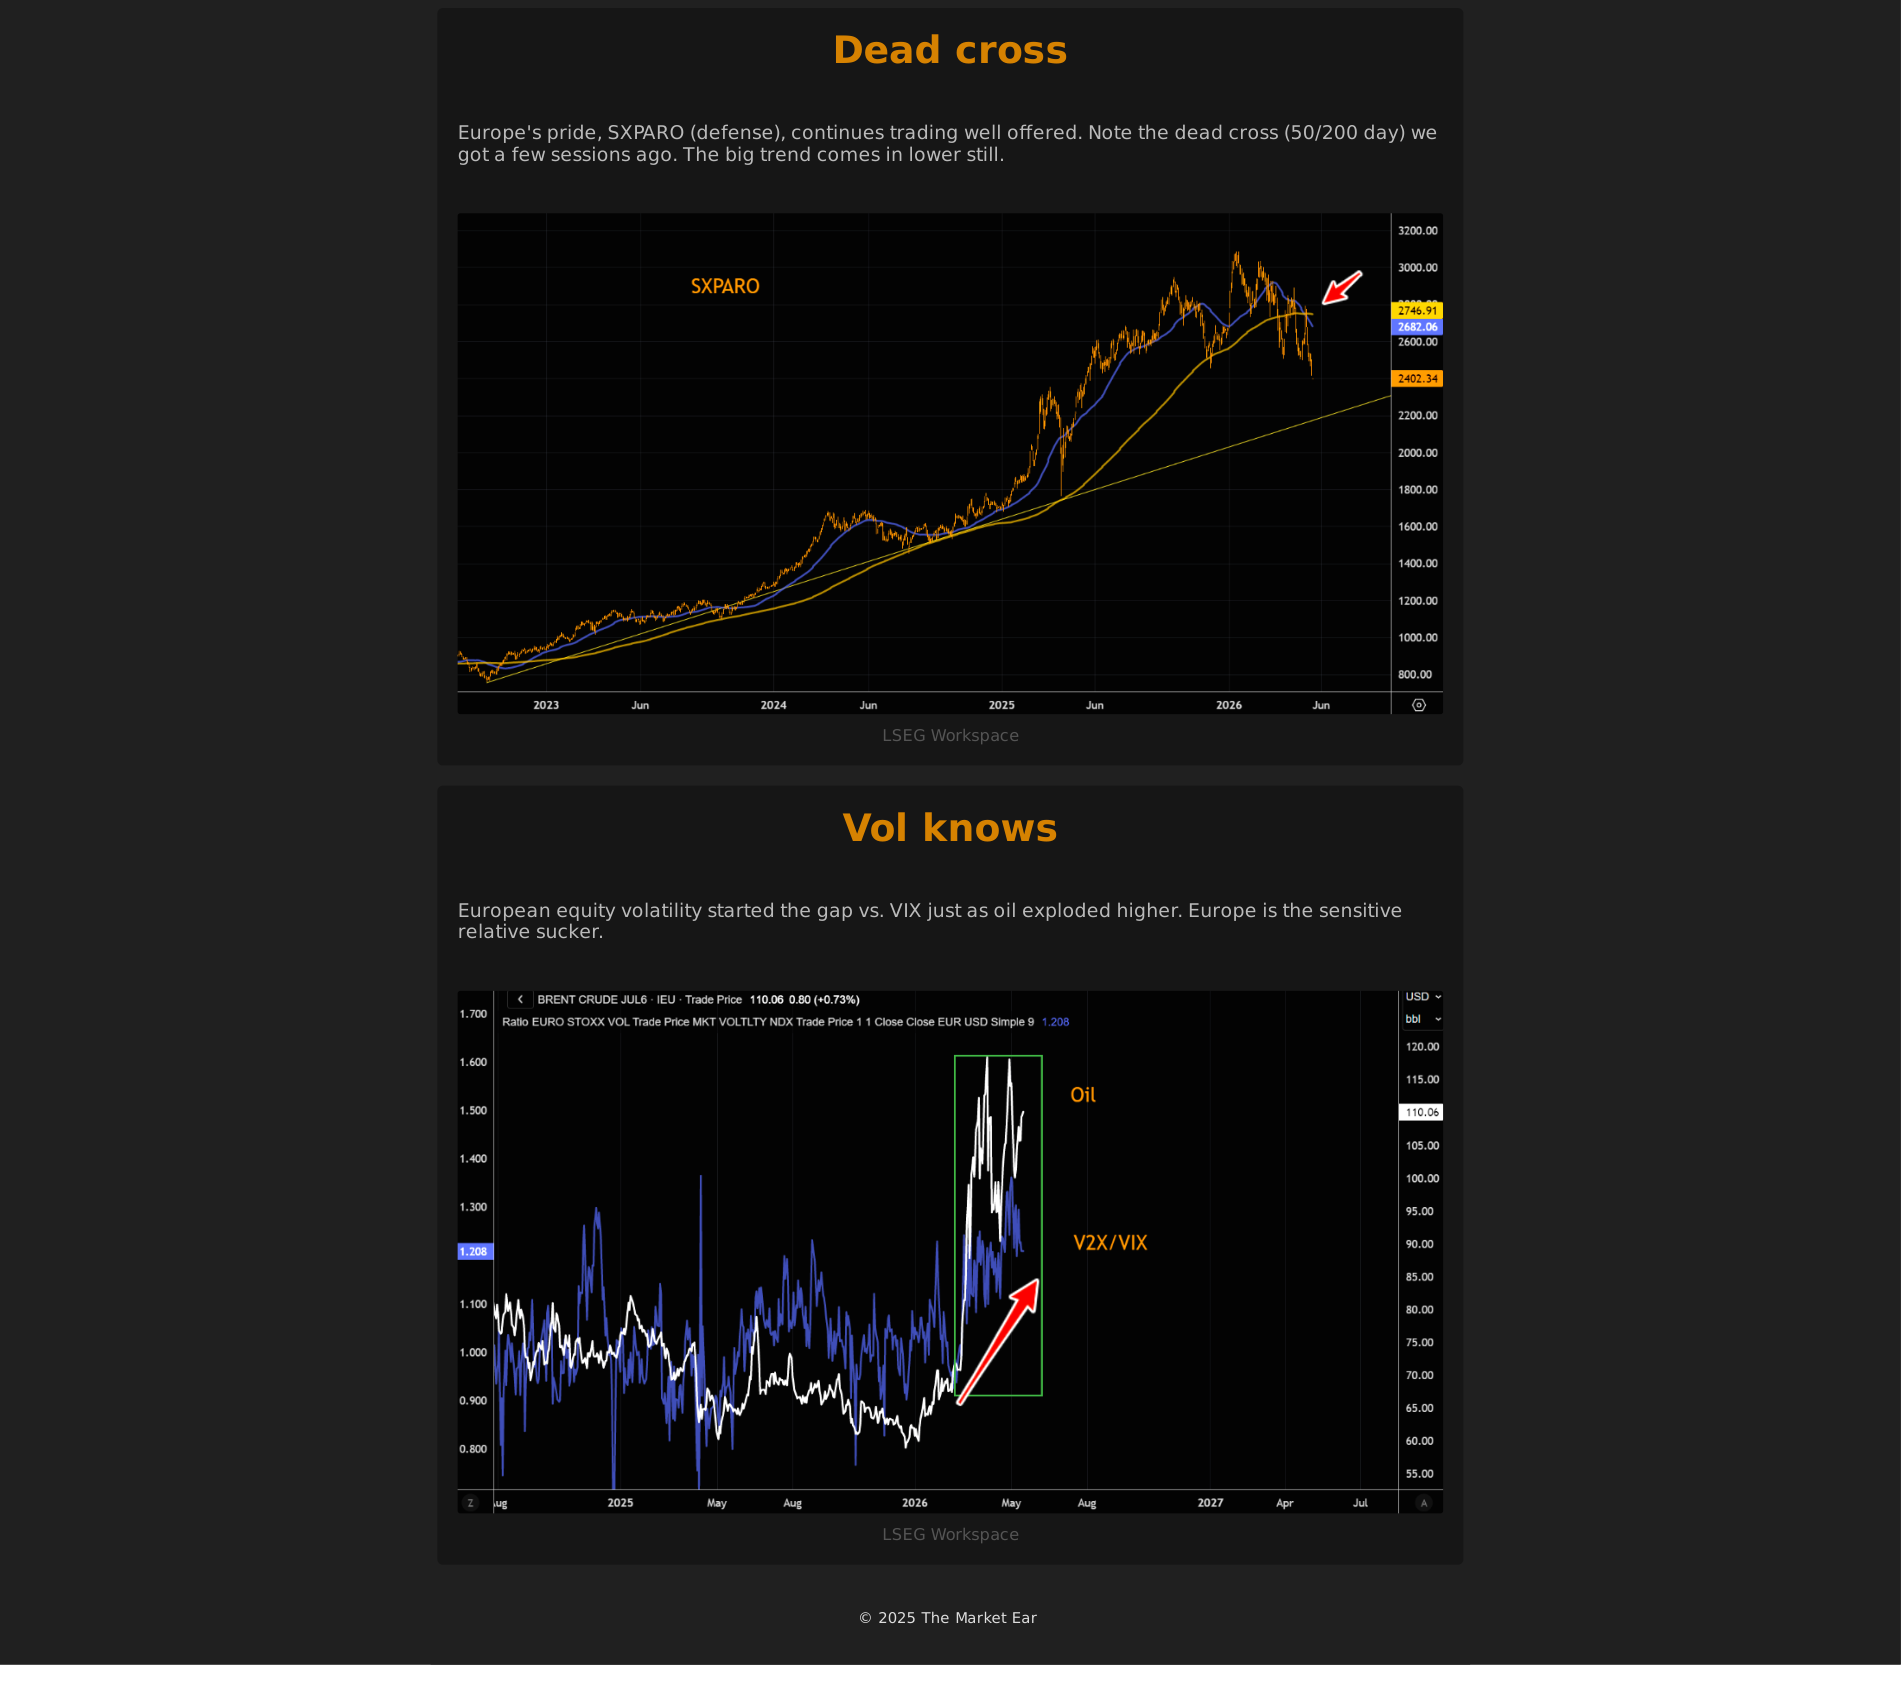
3. crowded leveraged fragile: Oil stress is feeding rates, while equities are looking through it
Page 4 | crowded leveraged fragile
What it says: crowded leveraged fragile: Dead cross Europe's pride, SXPARO (defense), continues trading well offered. Note the dead cross (50/200 day) we got a few sessions ago. The big trend comes in lower still. LSEG Workspace Vol knows European equity volatility started the gap vs. VIX just as...
Worldview update: The cleaner market signal is the cross-asset divergence: oil stress has mattered for rates, but equities are already looking through it. That calm is fragile if energy pressure starts feeding inflation or growth expectations again.
Portfolio/use: Track Brent, rates, and equity correlation together; use oil/rates stress as the warning light rather than treating headlines in isolation.
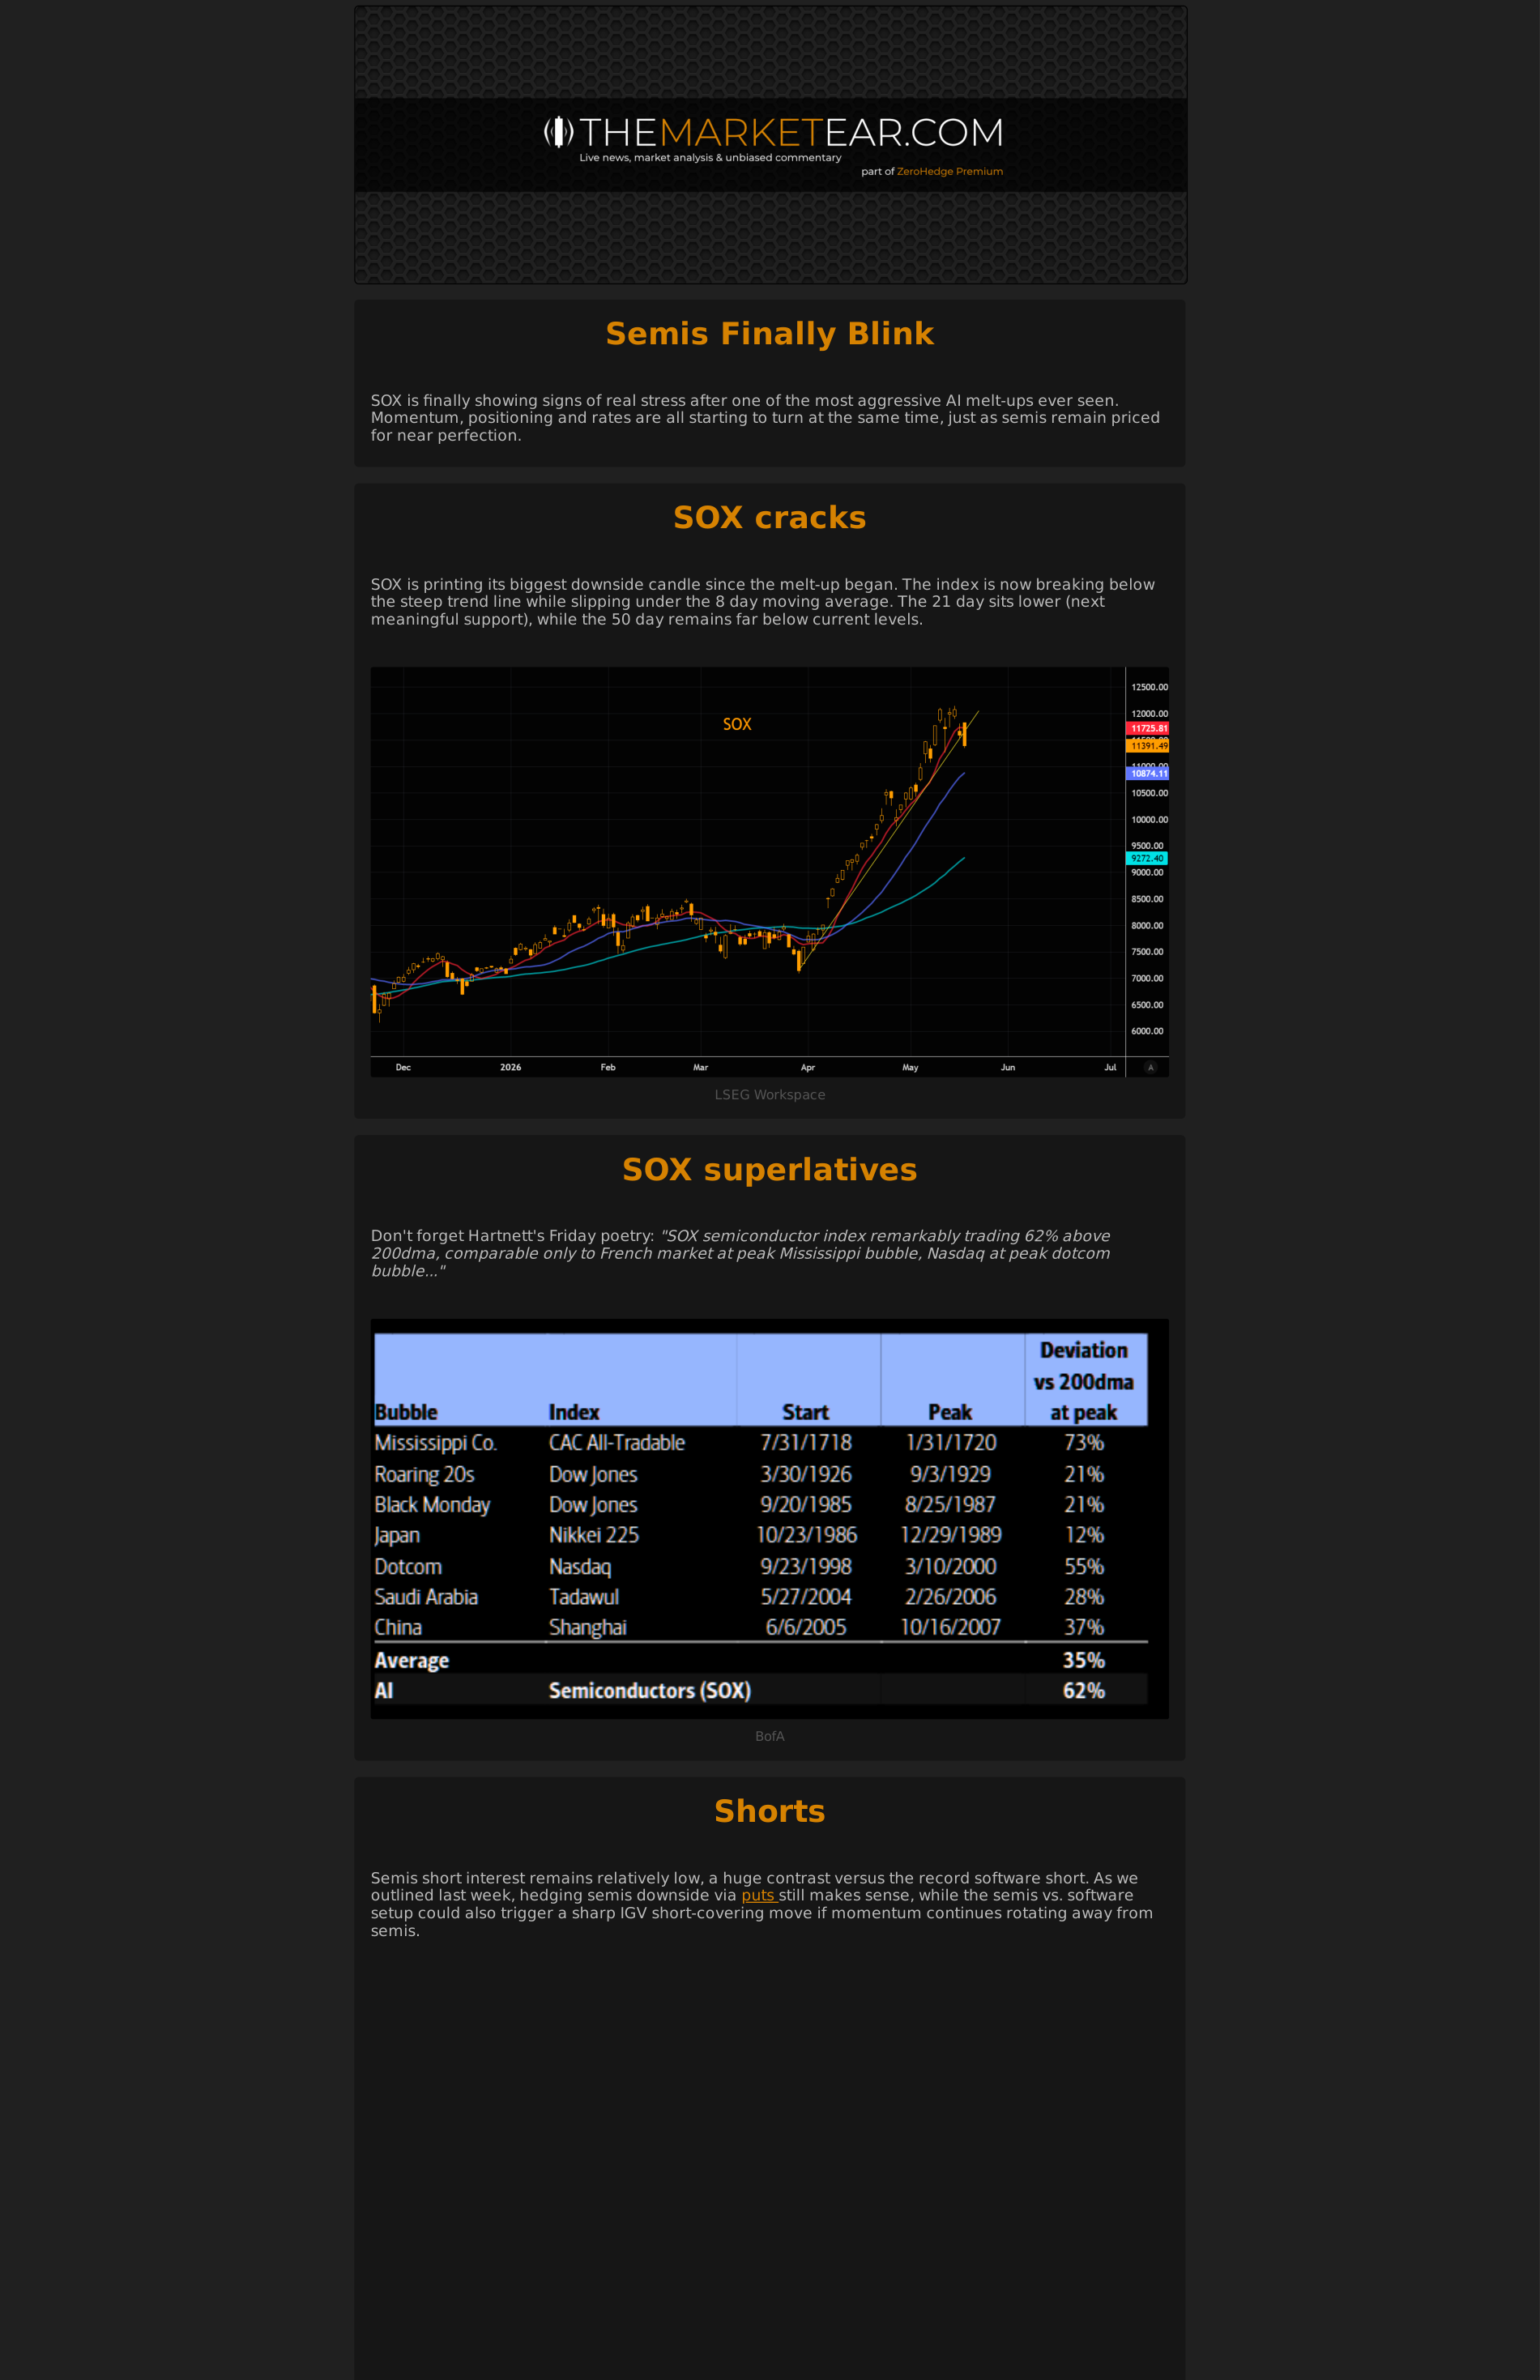
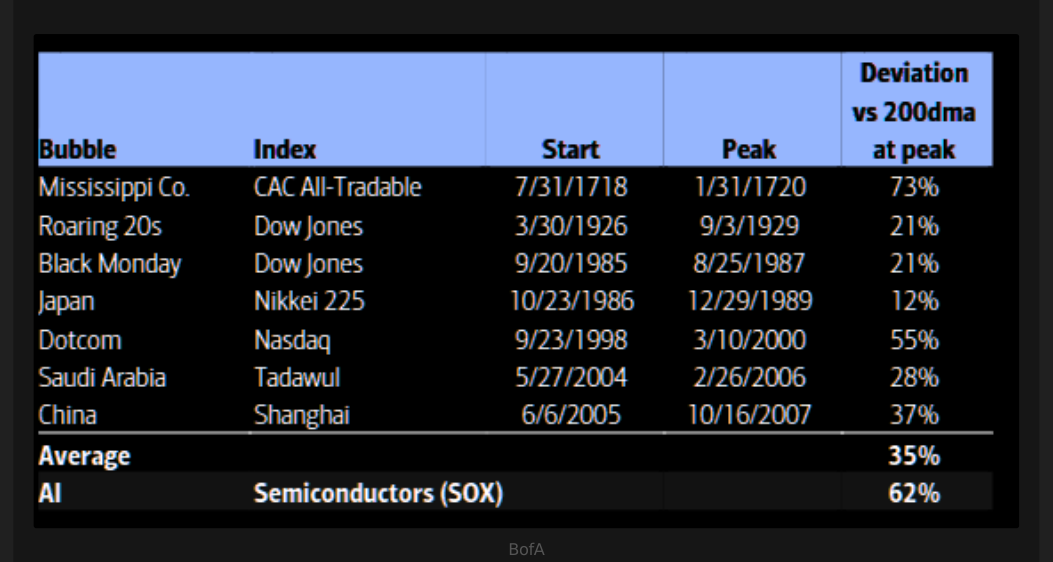
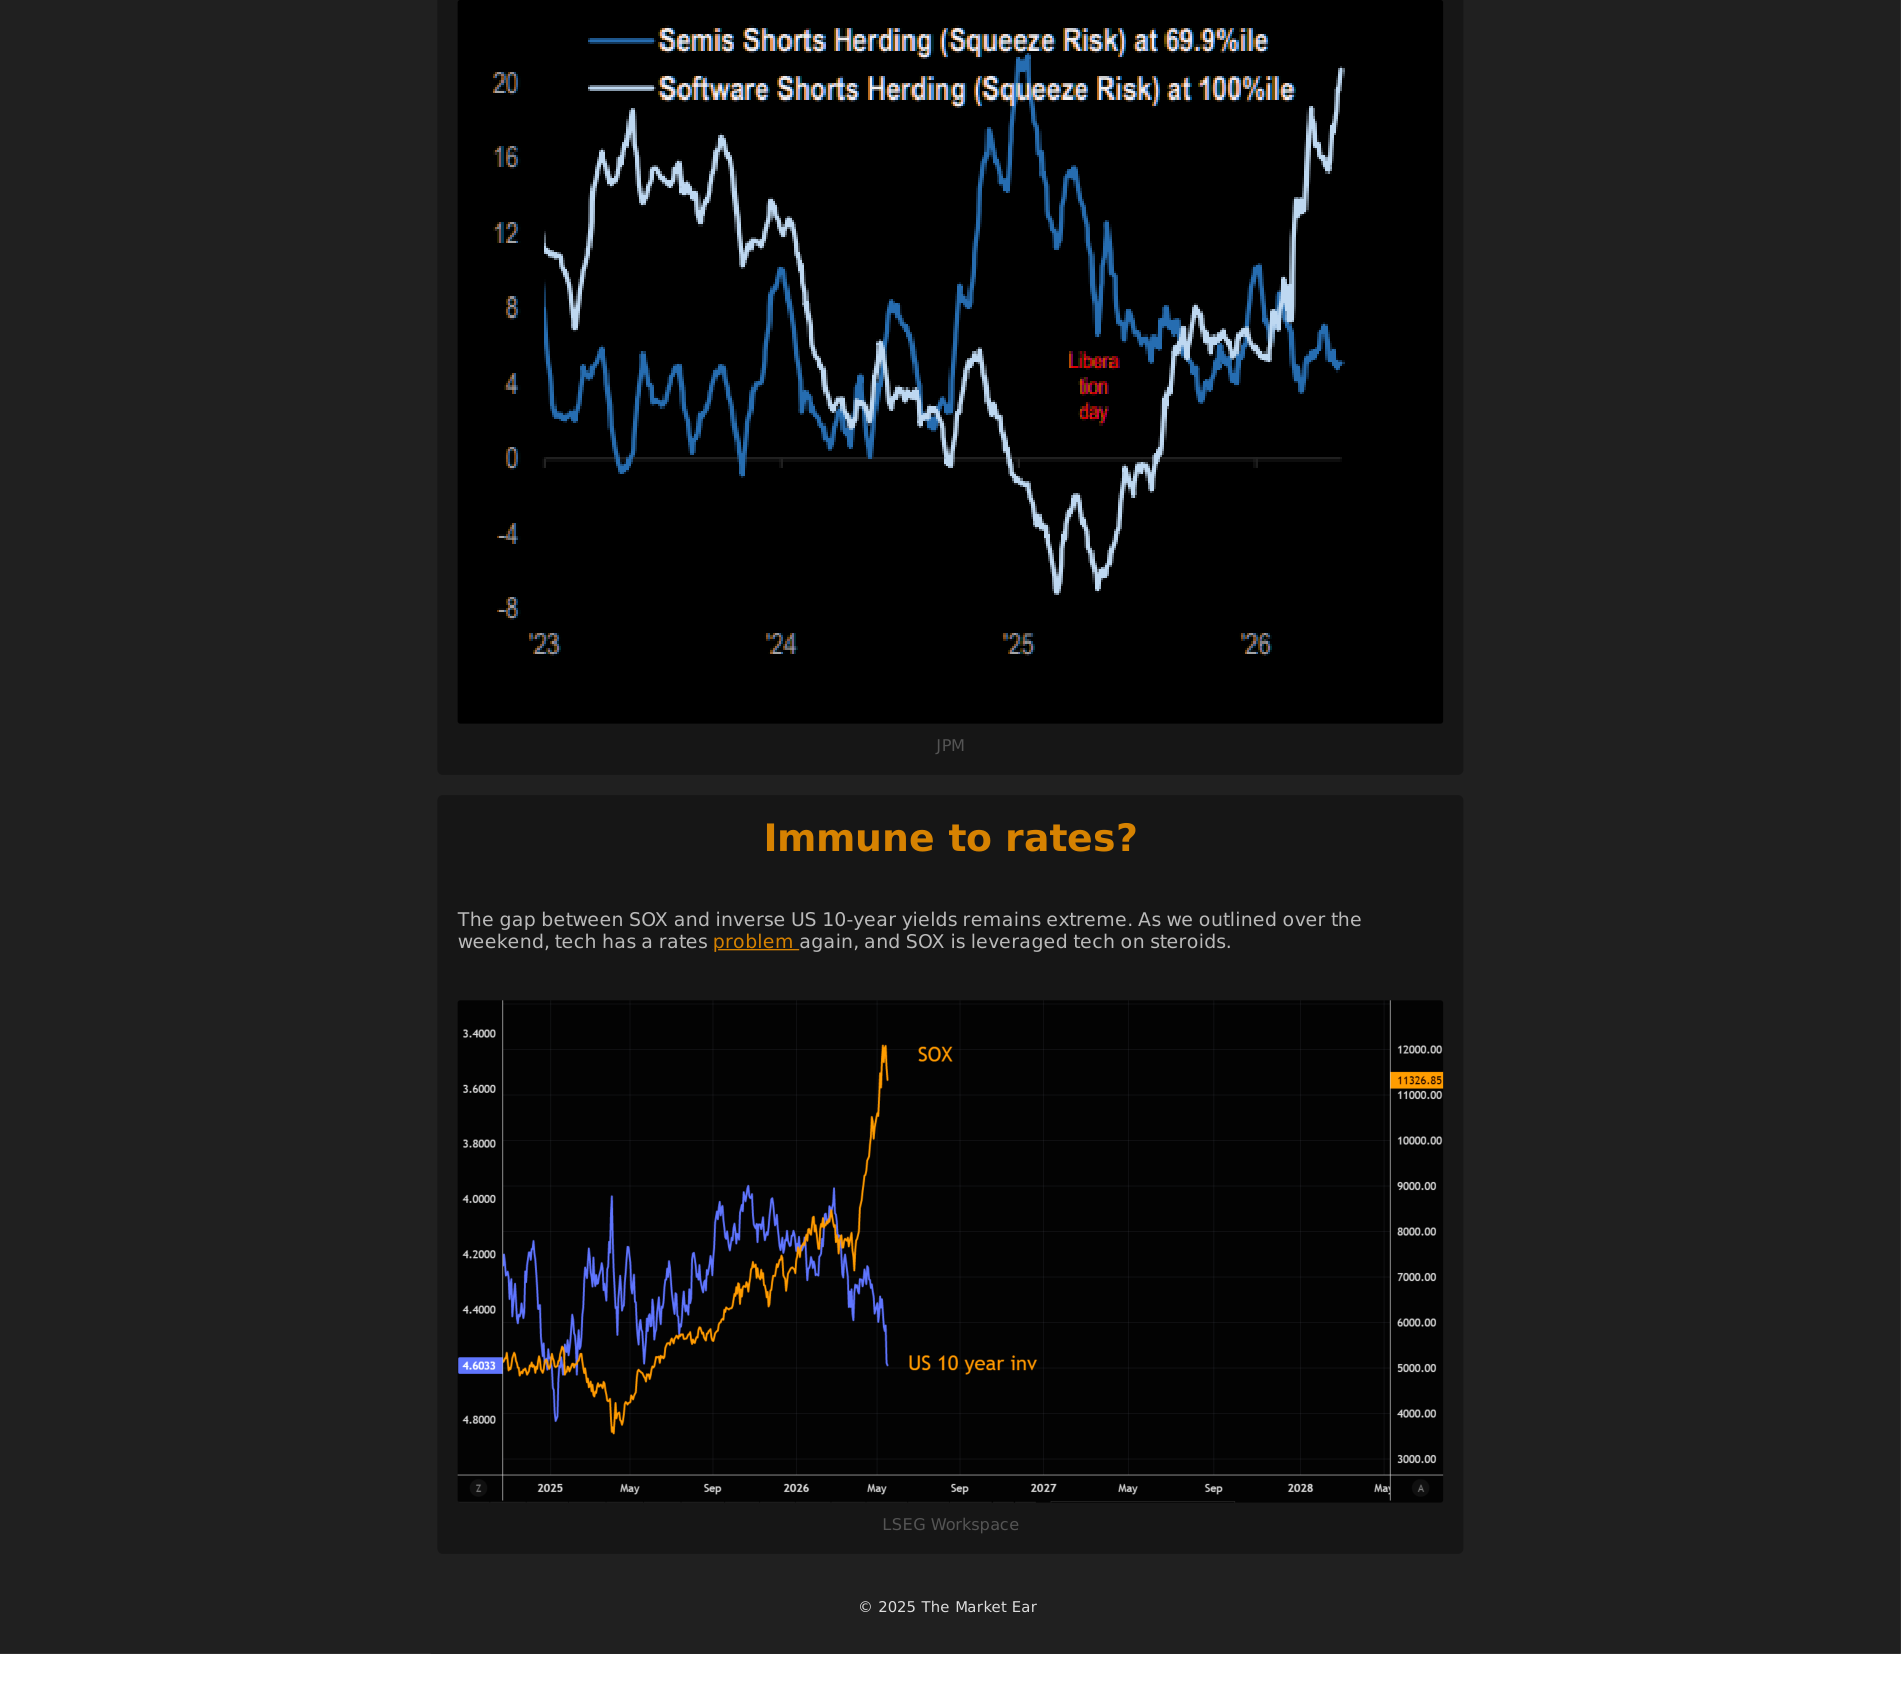
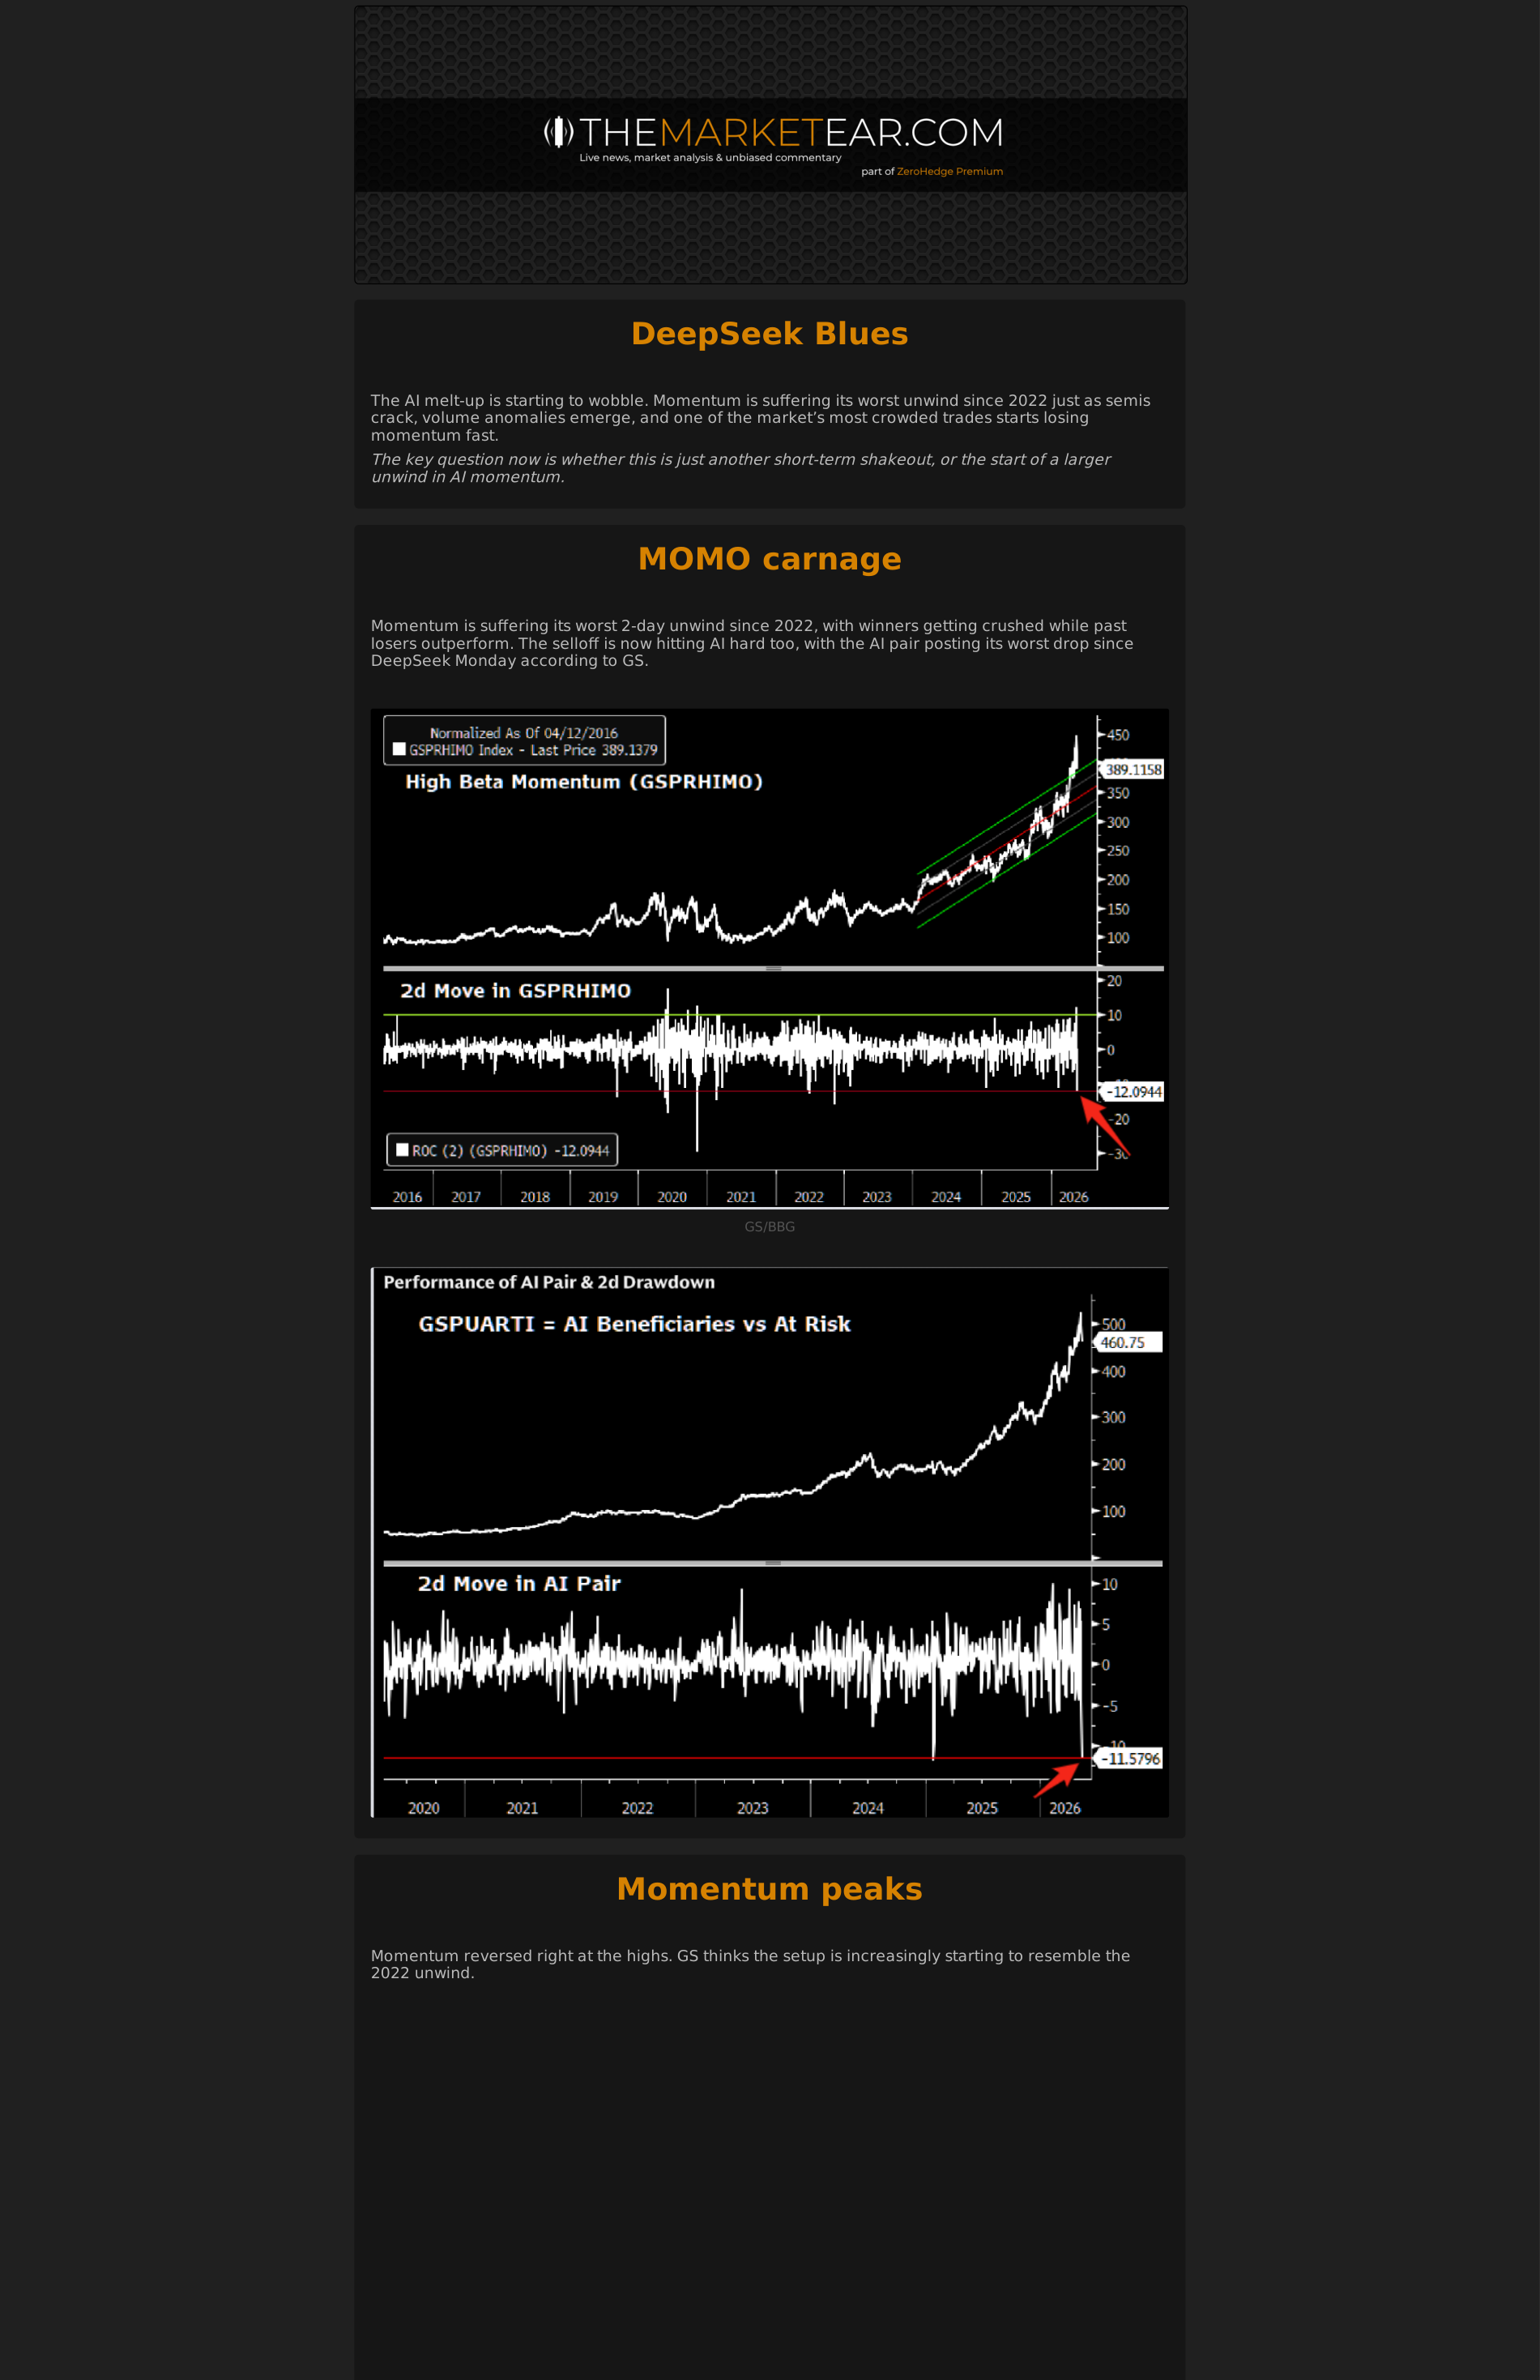
4. semis finally blink: AI is becoming a capex, power, and politics story
Page 1 | semis finally blink
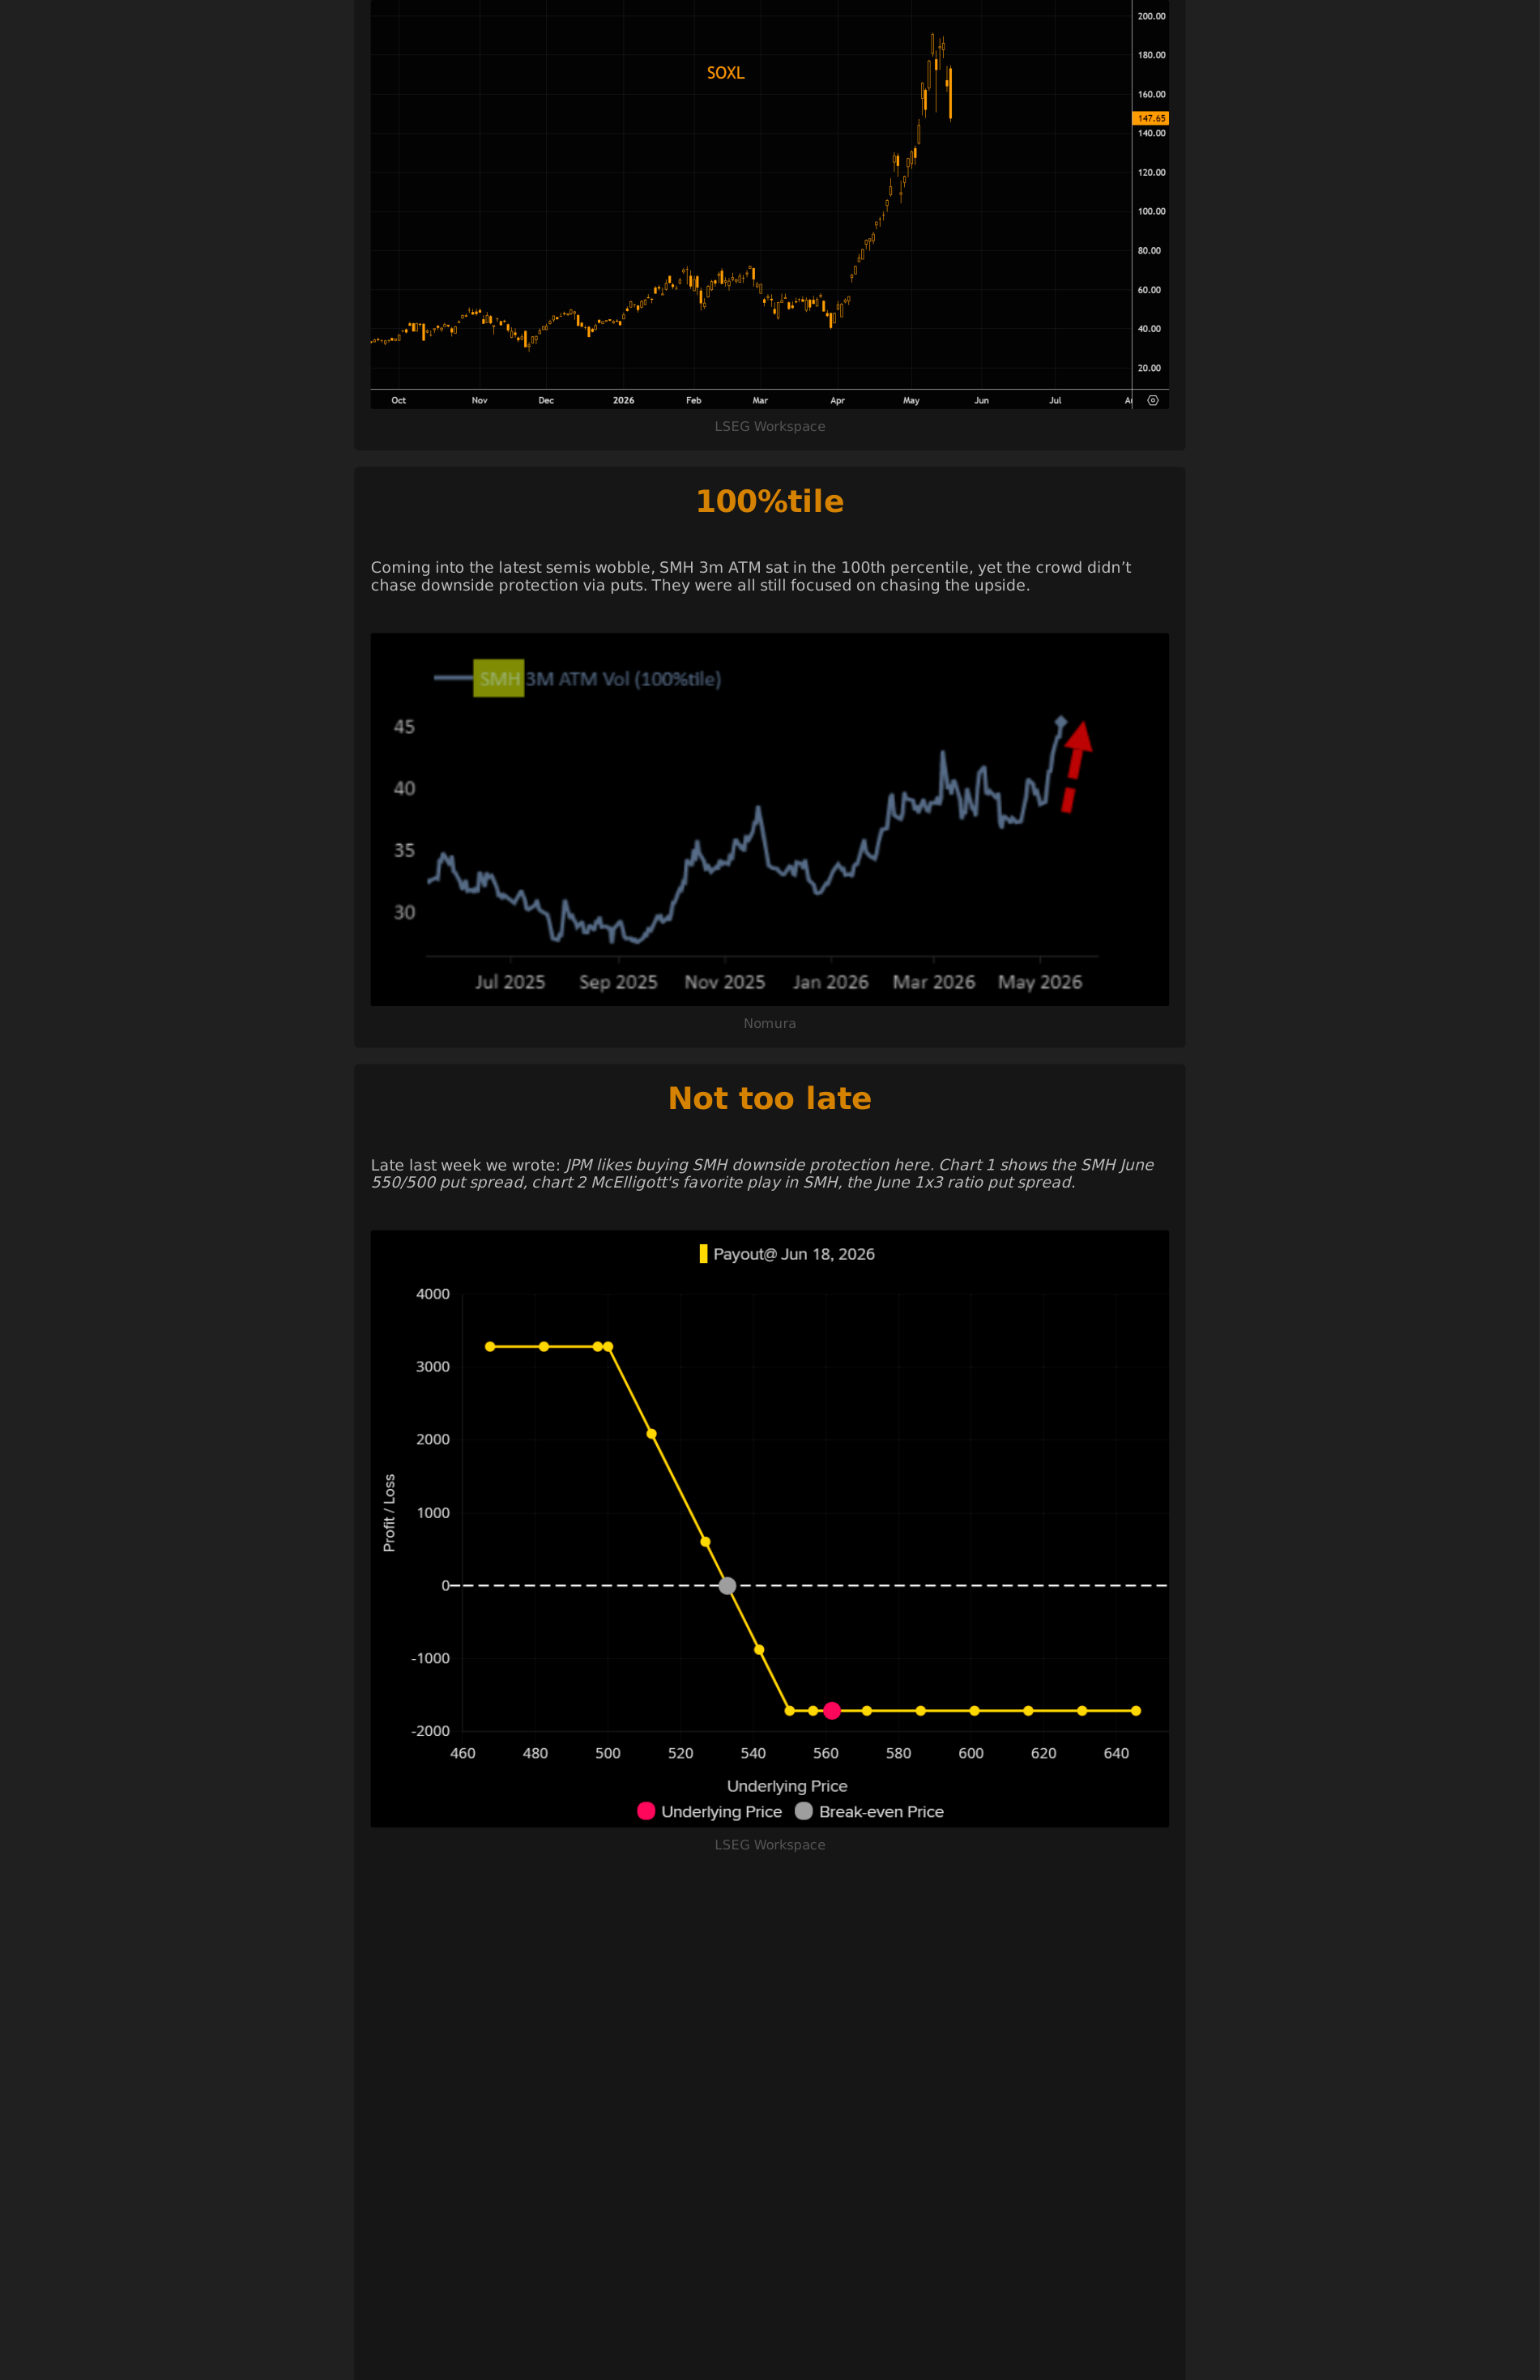
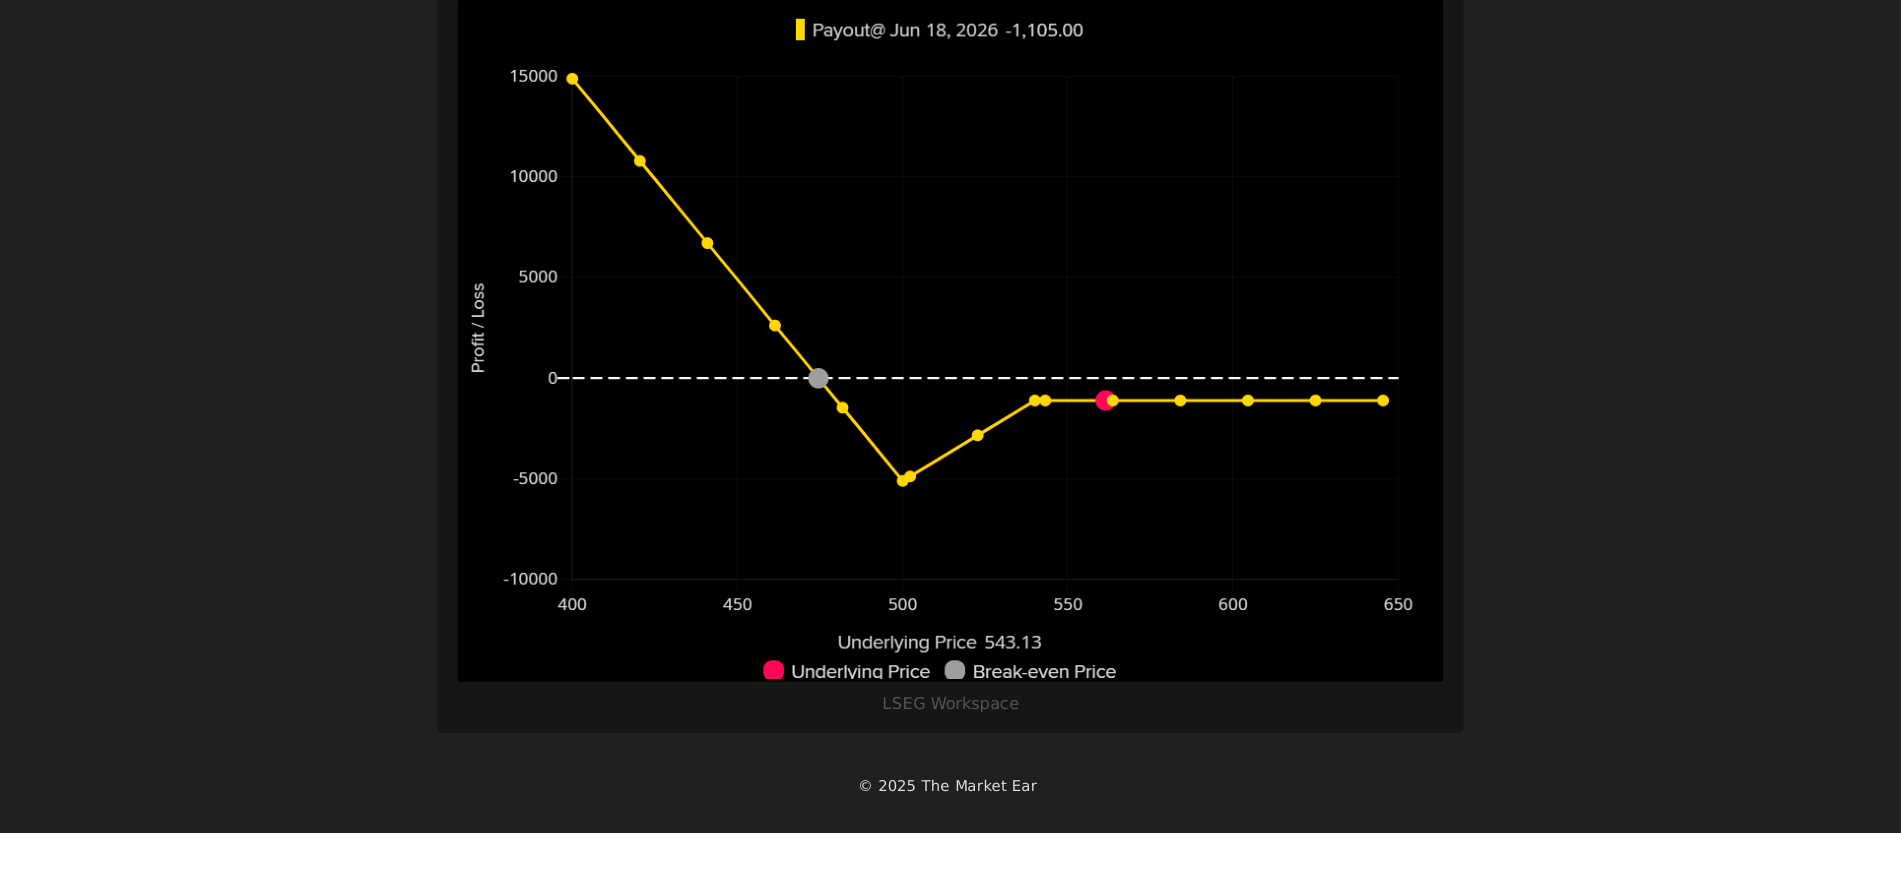
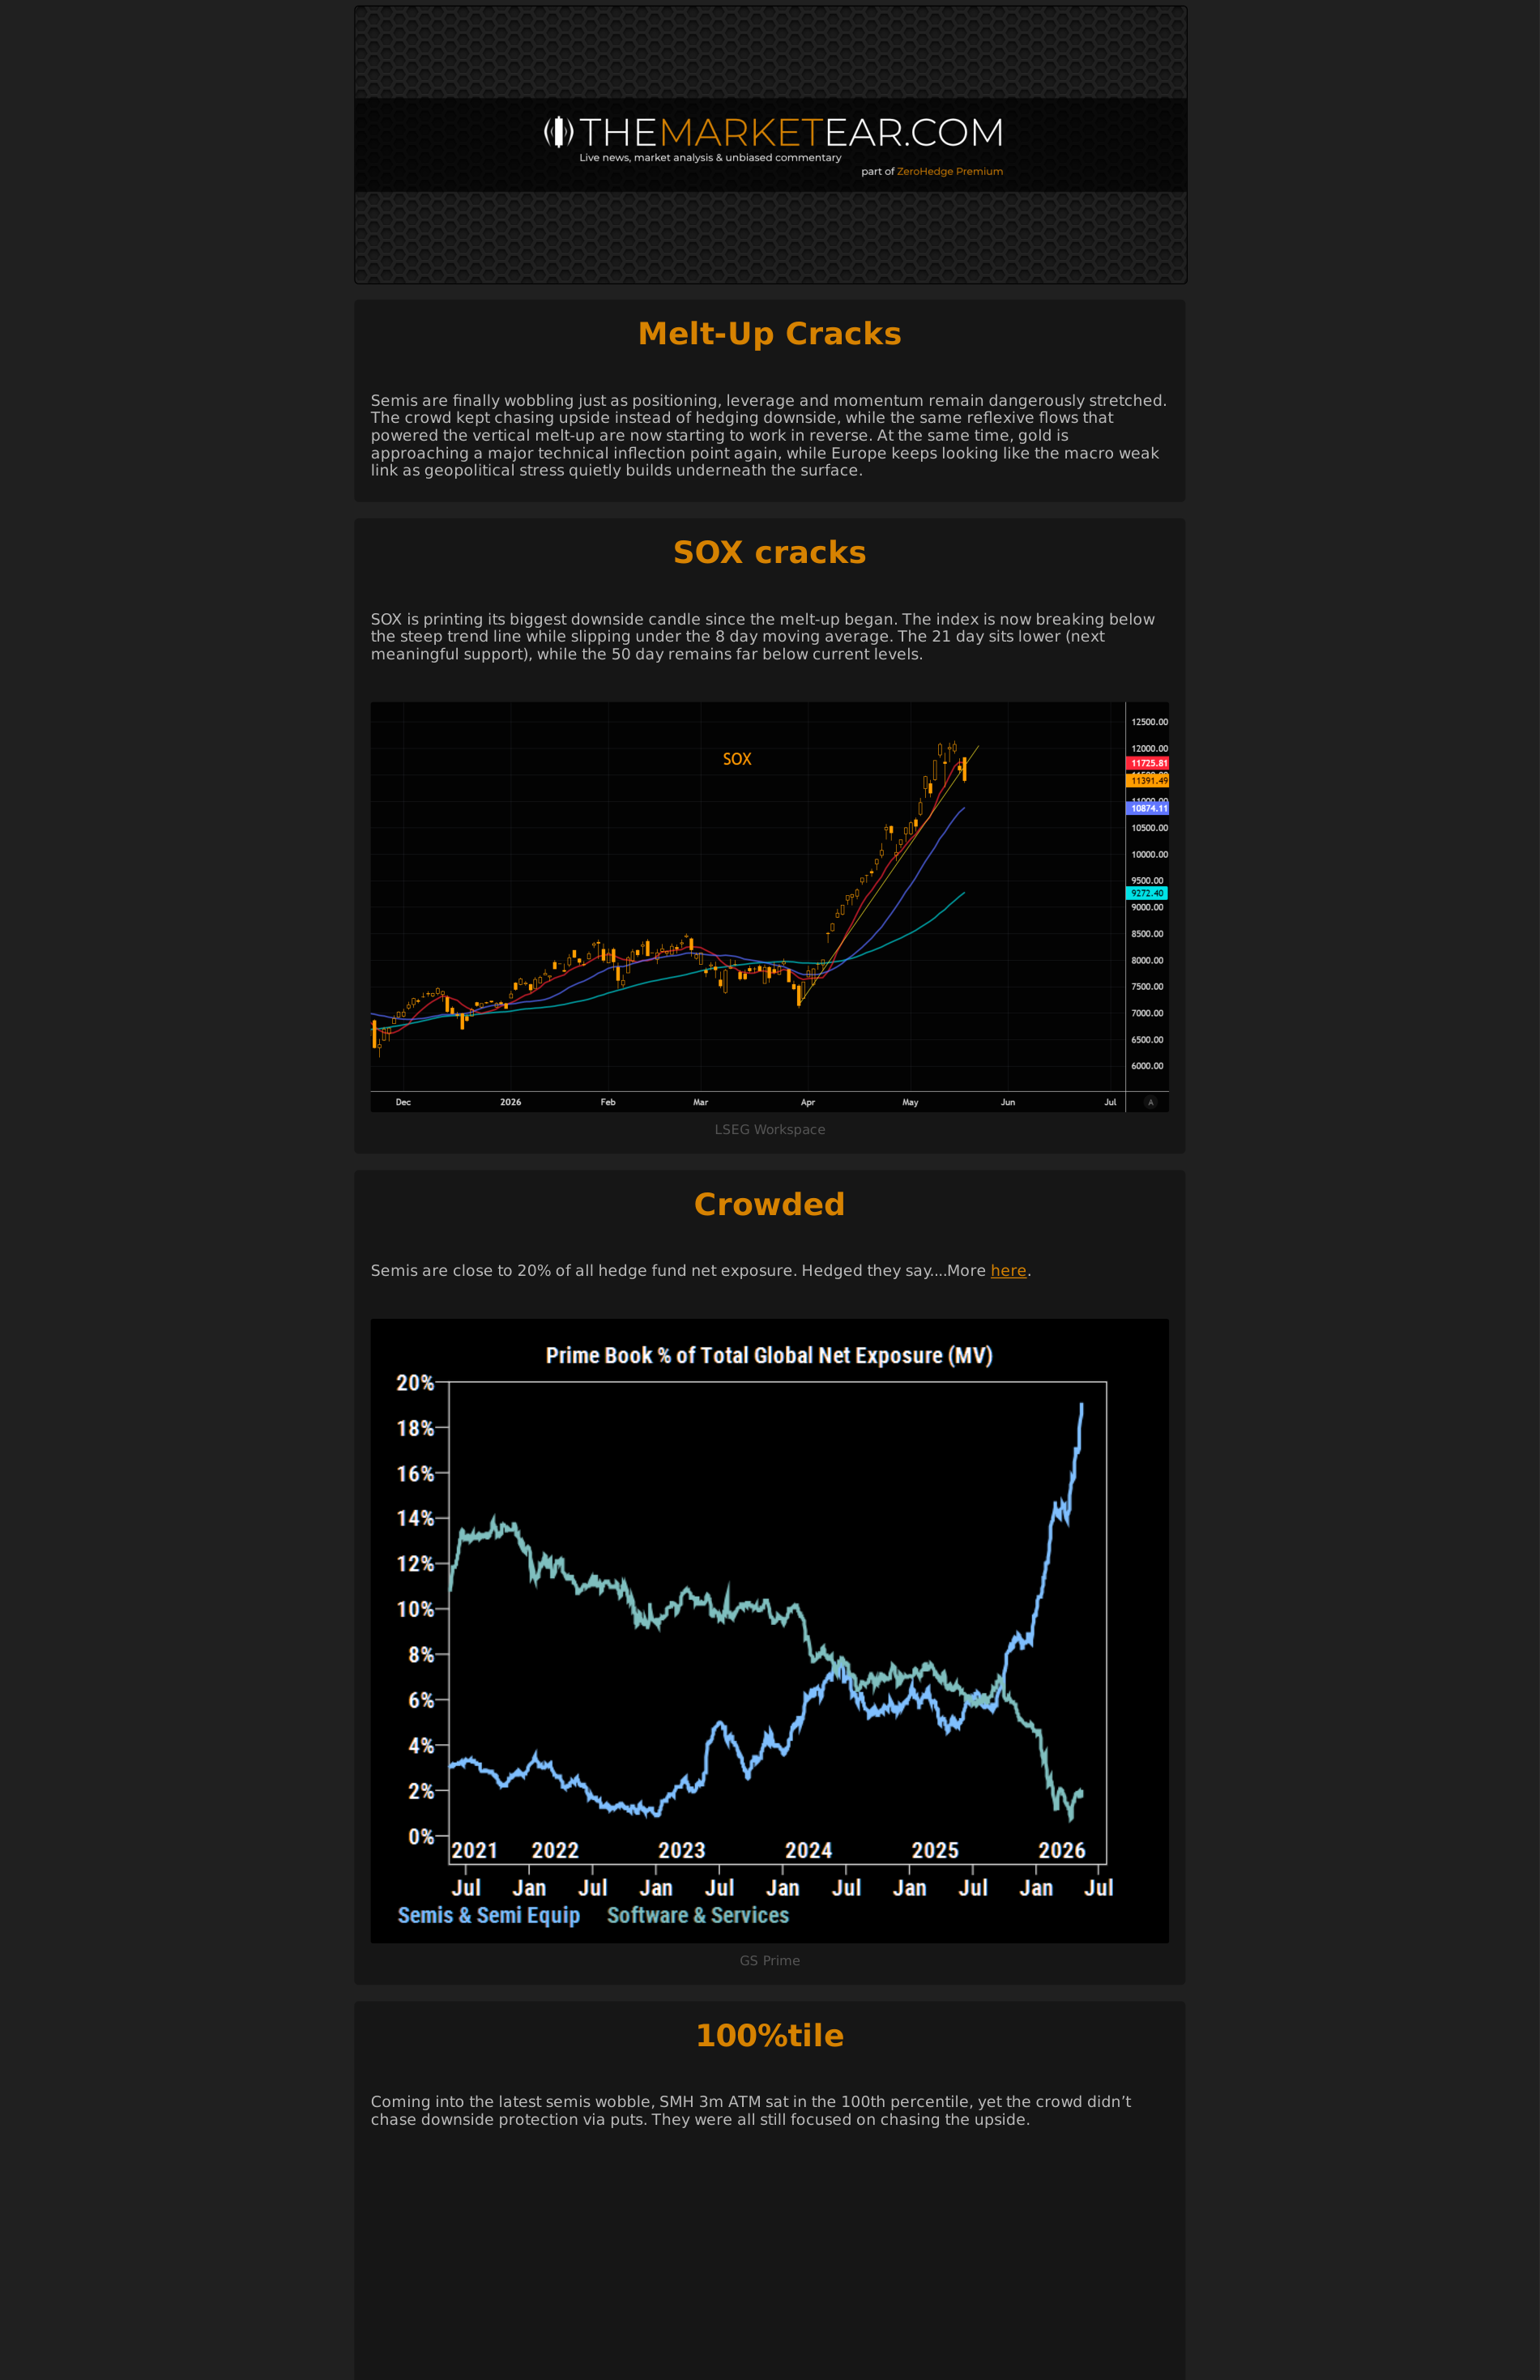
What it says: semis finally blink: Semis Finally Blink SOX is finally showing signs of real stress after one of the most aggressive AI melt-ups ever seen. Momentum, positioning and rates are all starting to turn at the same time, just as semis remain priced for near perfection. SOX cracks SO...
Worldview update: The AI trade is no longer only about demand and model progress. The constraint is shifting toward cash-flow intensity, grid capacity, permitting, and public tolerance.
Portfolio/use: Map AI exposure through power, grid, utilities, gas, and capex beneficiaries; be careful where capex consumes free cash flow.
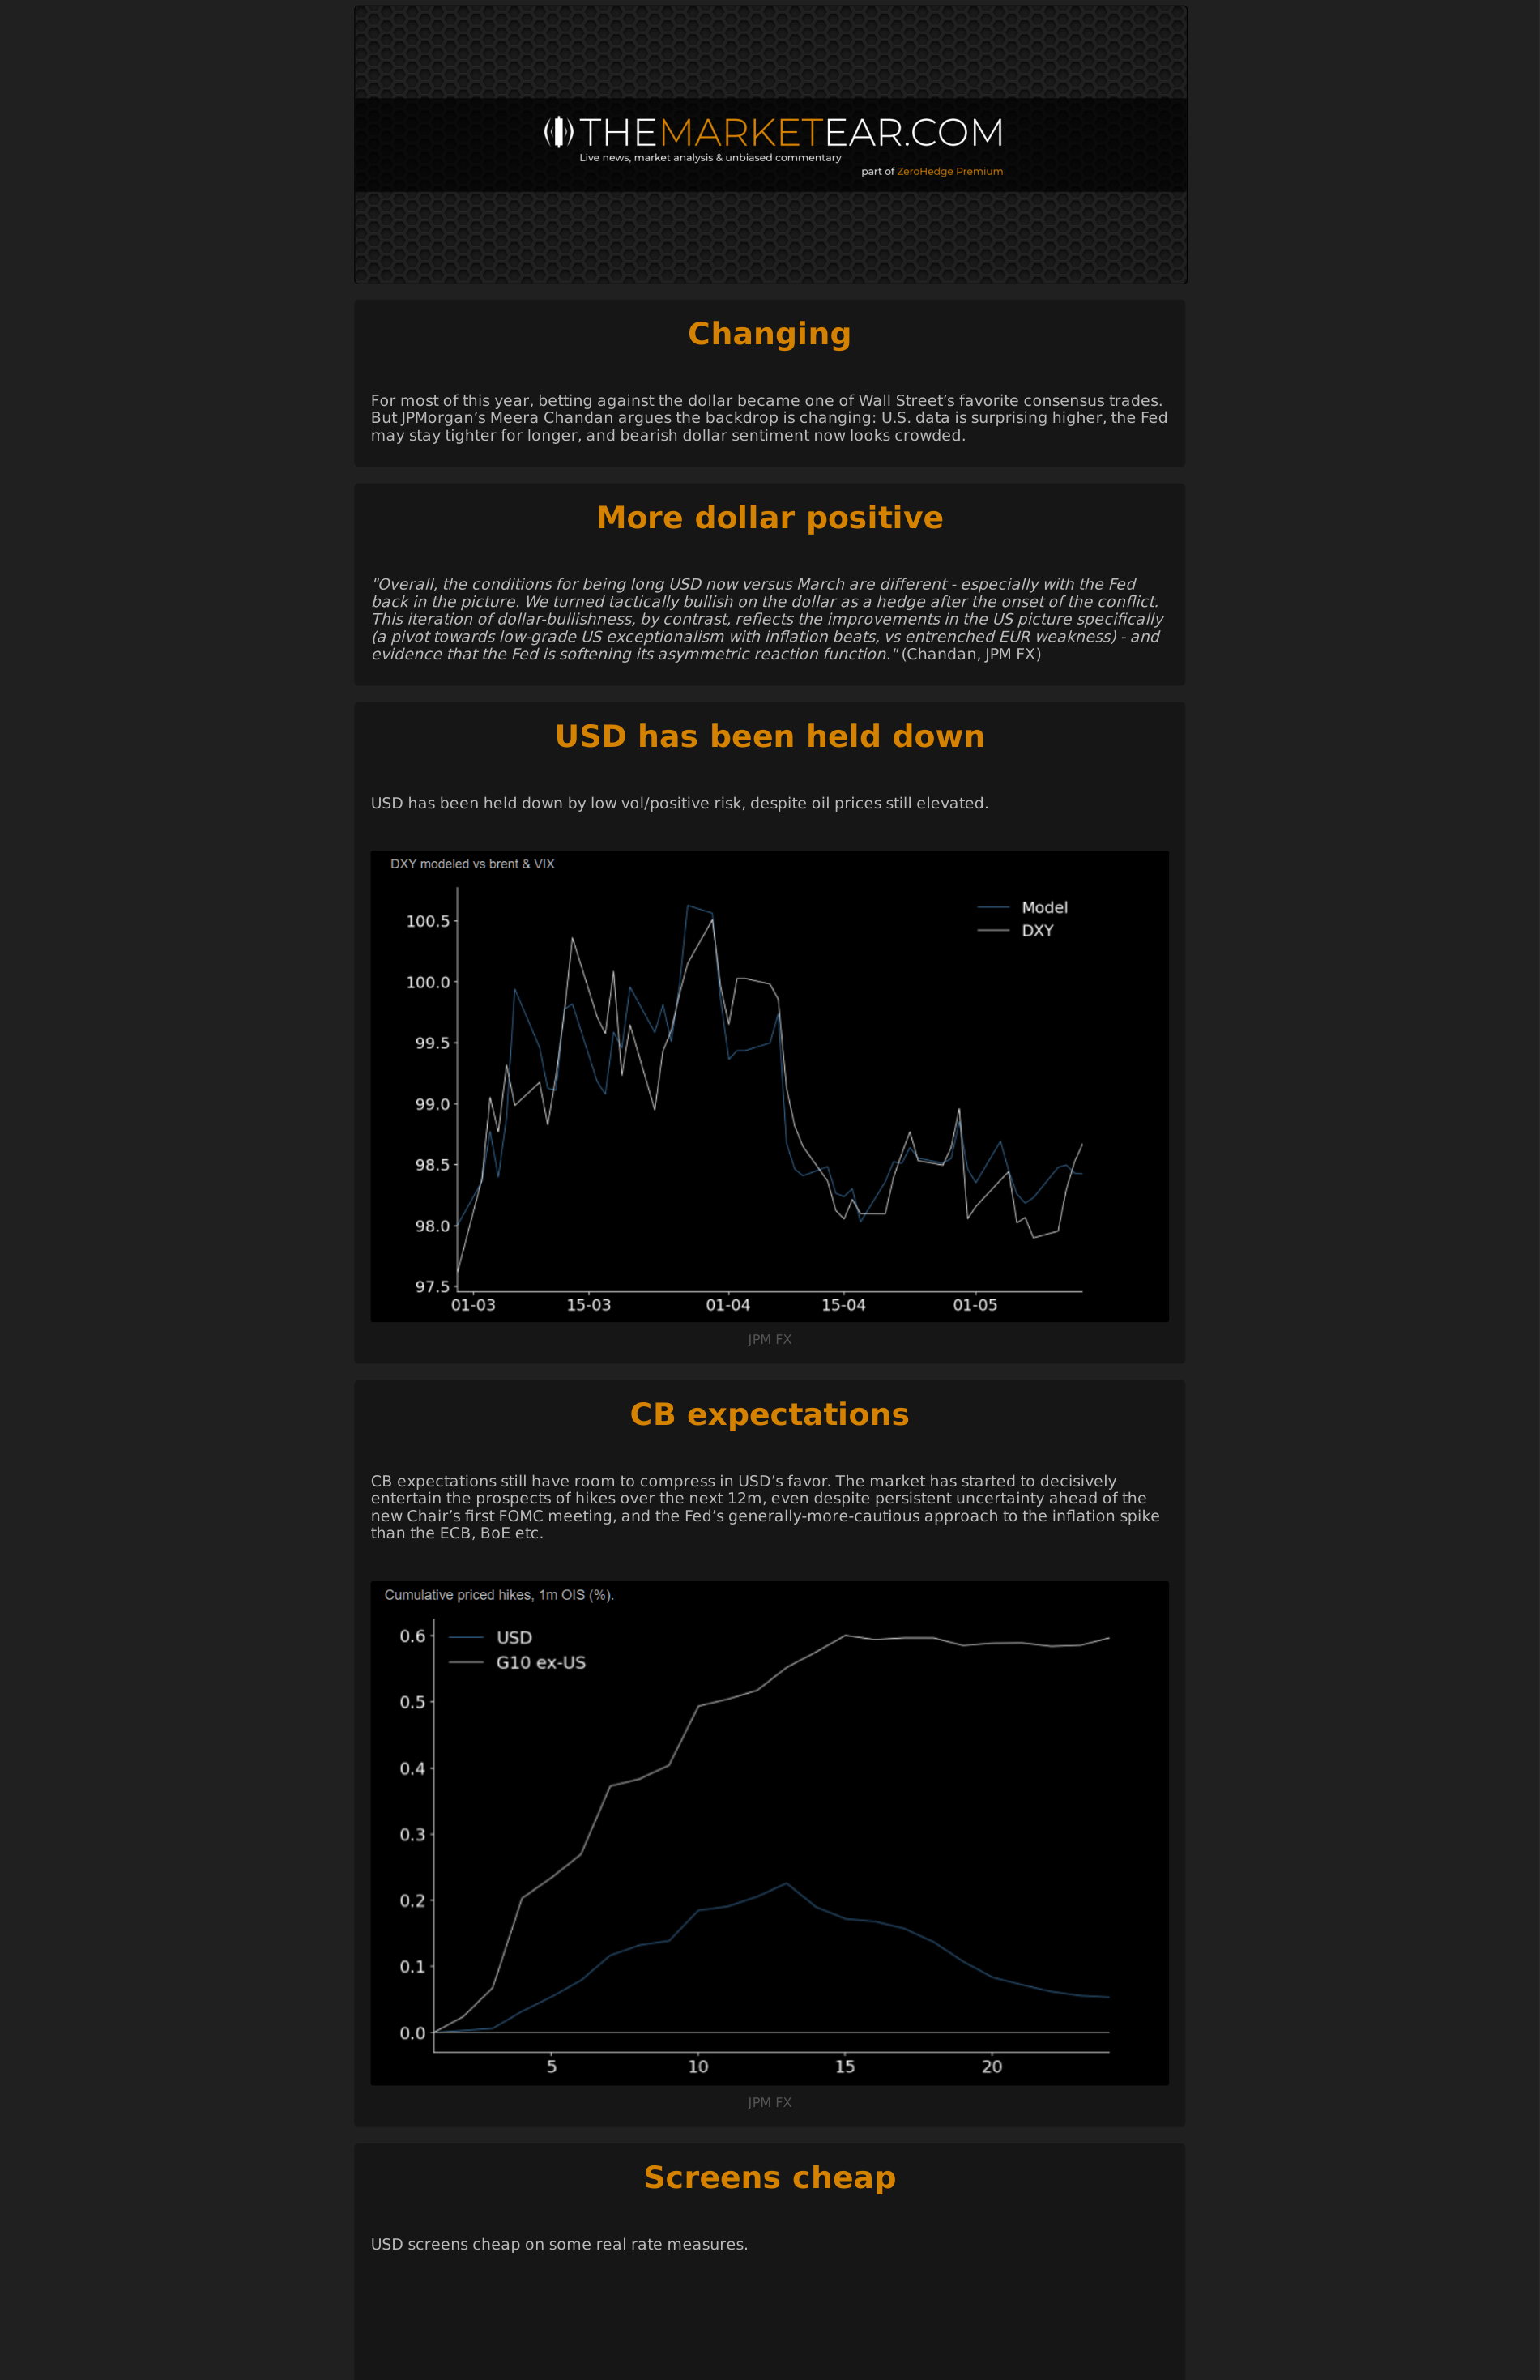
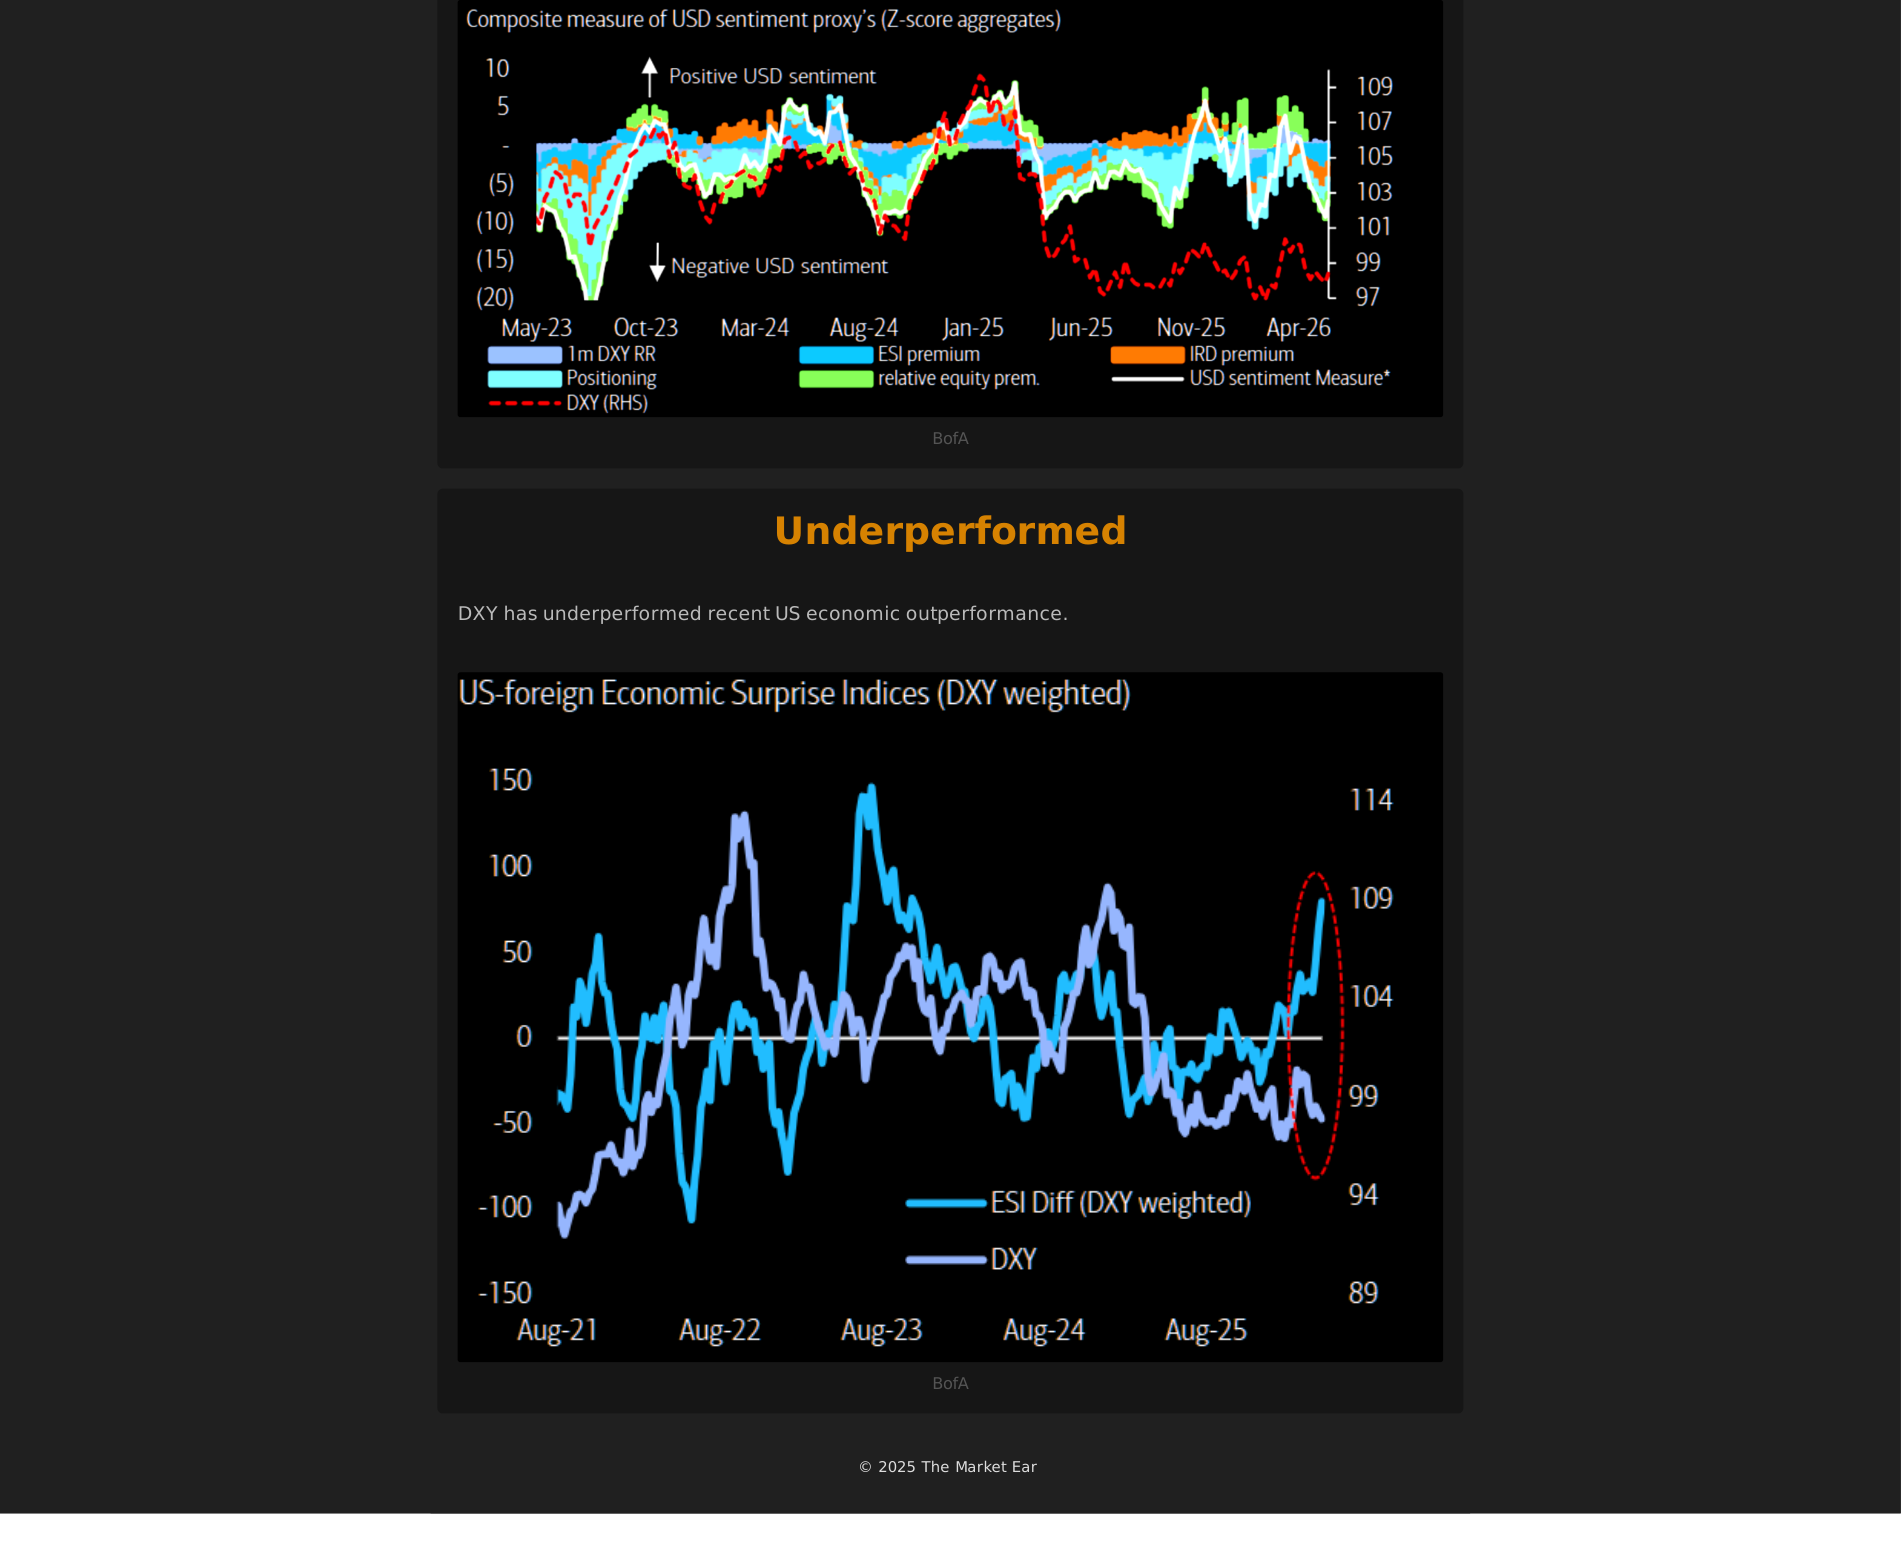
5. Jamie Dimon s Favorite FX Brain Is Buying Dollars Again: Europe has opportunity, but oil and FX can spoil it
Page 2 | Jamie Dimon s Favorite FX Brain Is Buying Dollars Again
What it says: Jamie Dimon s Favorite FX Brain Is Buying Dollars Again: JPM FX Follow the MoMo EUR/USD has generally followed relative momentum of late, which favors USD. JPM FX US equity outperformance helps US equity outperformance has delivered a nascent boost to USD, after acting as a draft around the turn of the year. Char...
Worldview update: Europe has an earnings and under-positioning setup, but it is also more exposed to energy disappointment and currency pressure.
Portfolio/use: Prefer European longs with earnings momentum and lower energy sensitivity; hedge EUR risk when oil stress rises.
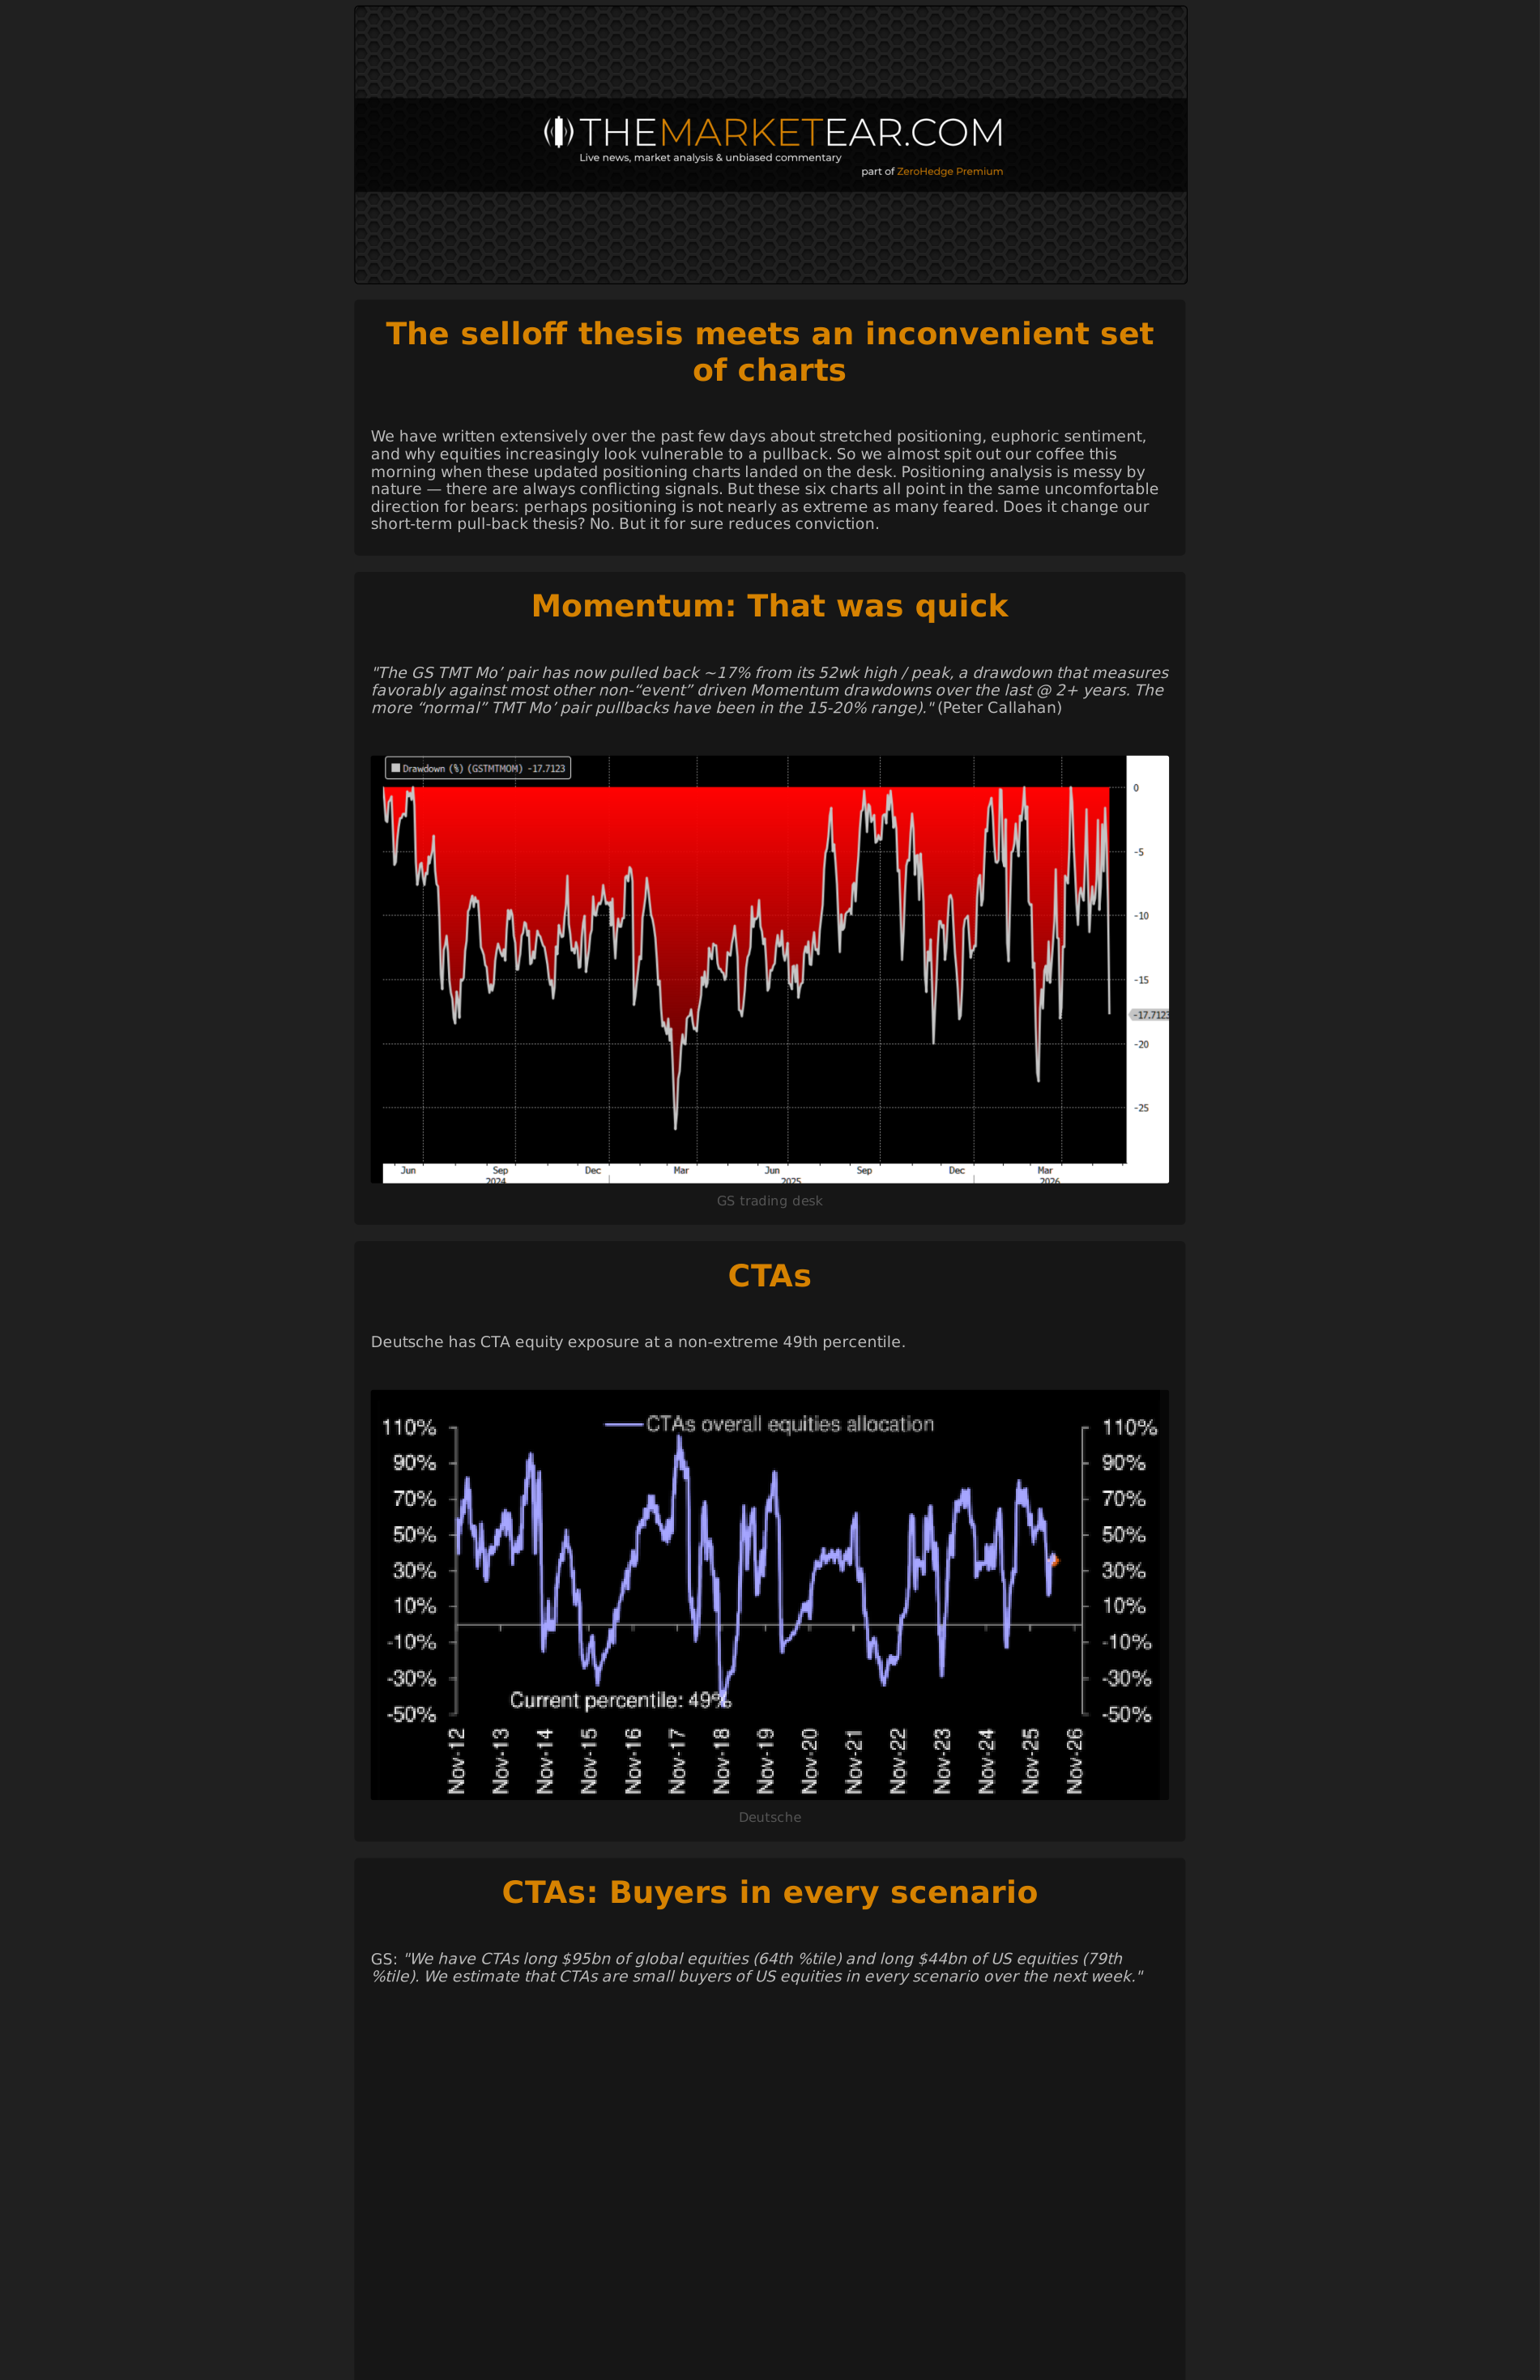
6. we were ready to increase our short then these charts showed up: Retail attention is a crowding signal again
Page 1 | we were ready to increase our short then these charts showed up
What it says: we were ready to increase our short then these charts showed up: The selloff thesis meets an inconvenient set of charts We have written extensively over the past few days about stretched positioning, euphoric sentiment, and why equities increasingly look vulnerable to a pullback. So we almost spit out our coffee this mor...
Worldview update: Retail flow is no longer just background noise. It is reinforcing single-name momentum and can stretch valuations past fundamentals.
Portfolio/use: Treat retail favorites as path-dependent momentum trades; use options or tight risk rather than valuation-only shorts.
Daily Shot
Daily Shot was unavailable for this run.
Additional Chart Selection
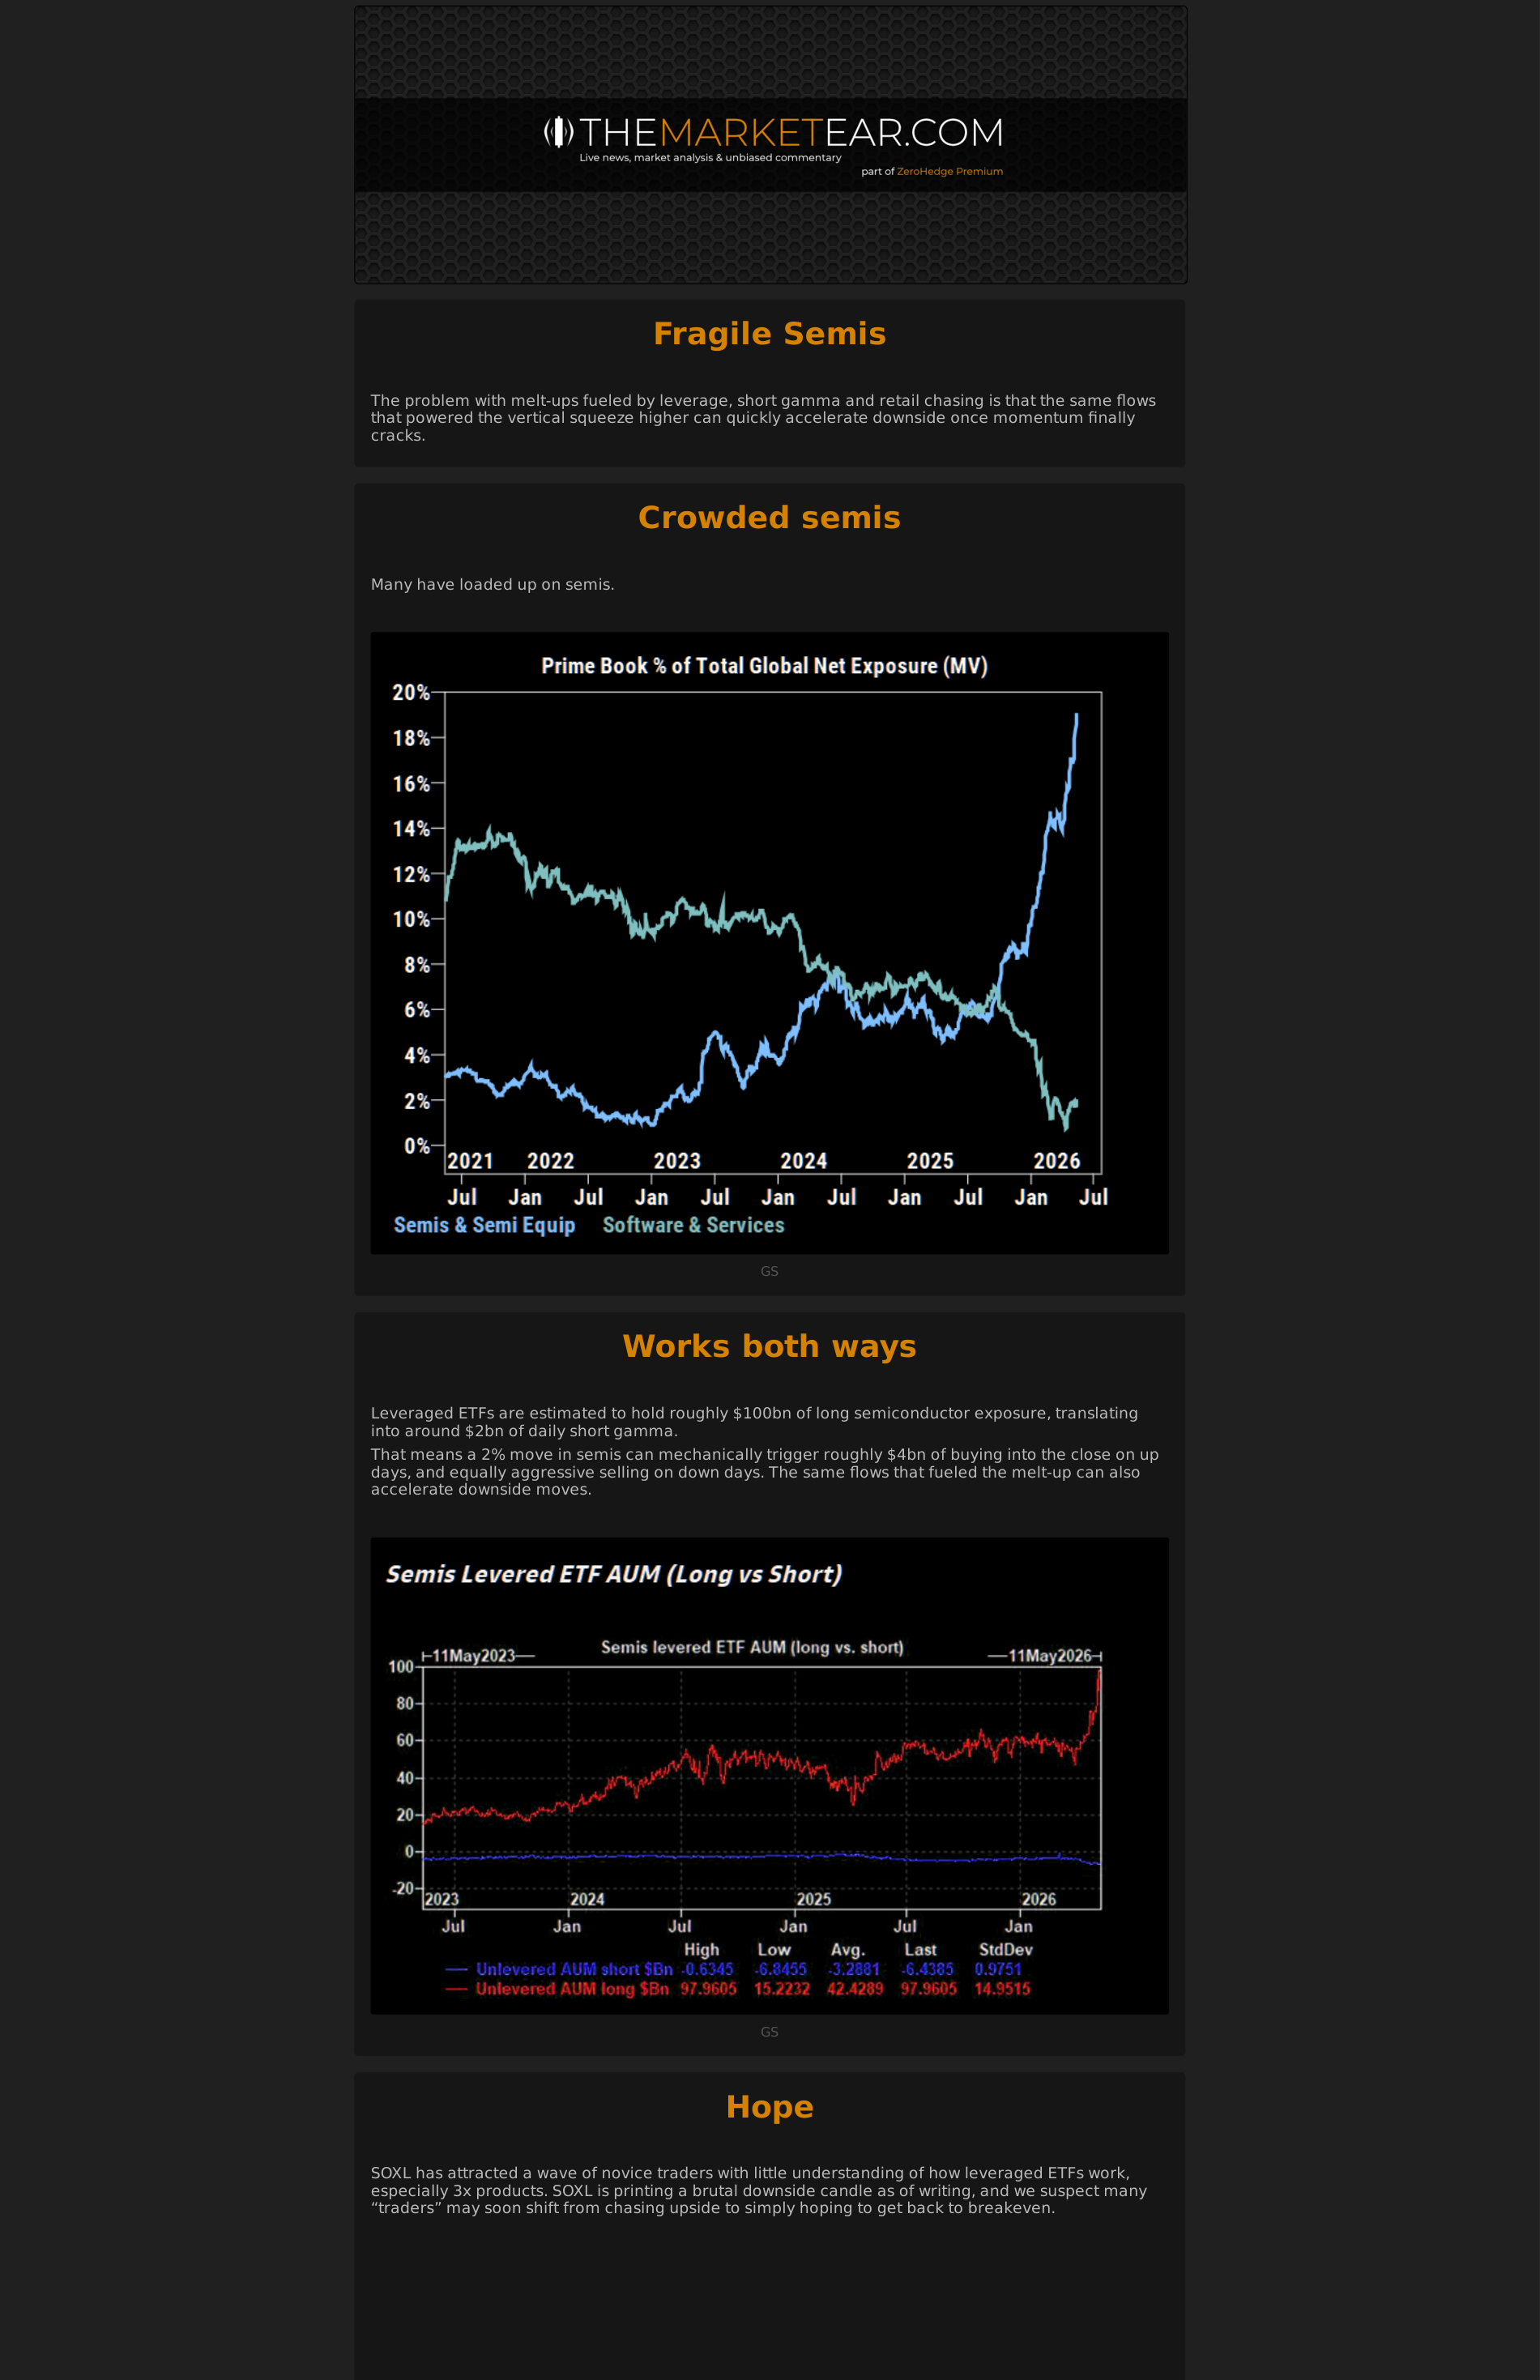
semis finally blink
2 additional extracted charts
Chart 1
Page 1 | image-block | score 0.438
Chart 2
Page 2 | vector-cluster | score 0.772
JPM US Equity Derivatives Strategy Tactical Upside Trades in AMZN
2 additional extracted charts
Chart 1
Page 3 | vector-cluster | score 0.820
Chart 2
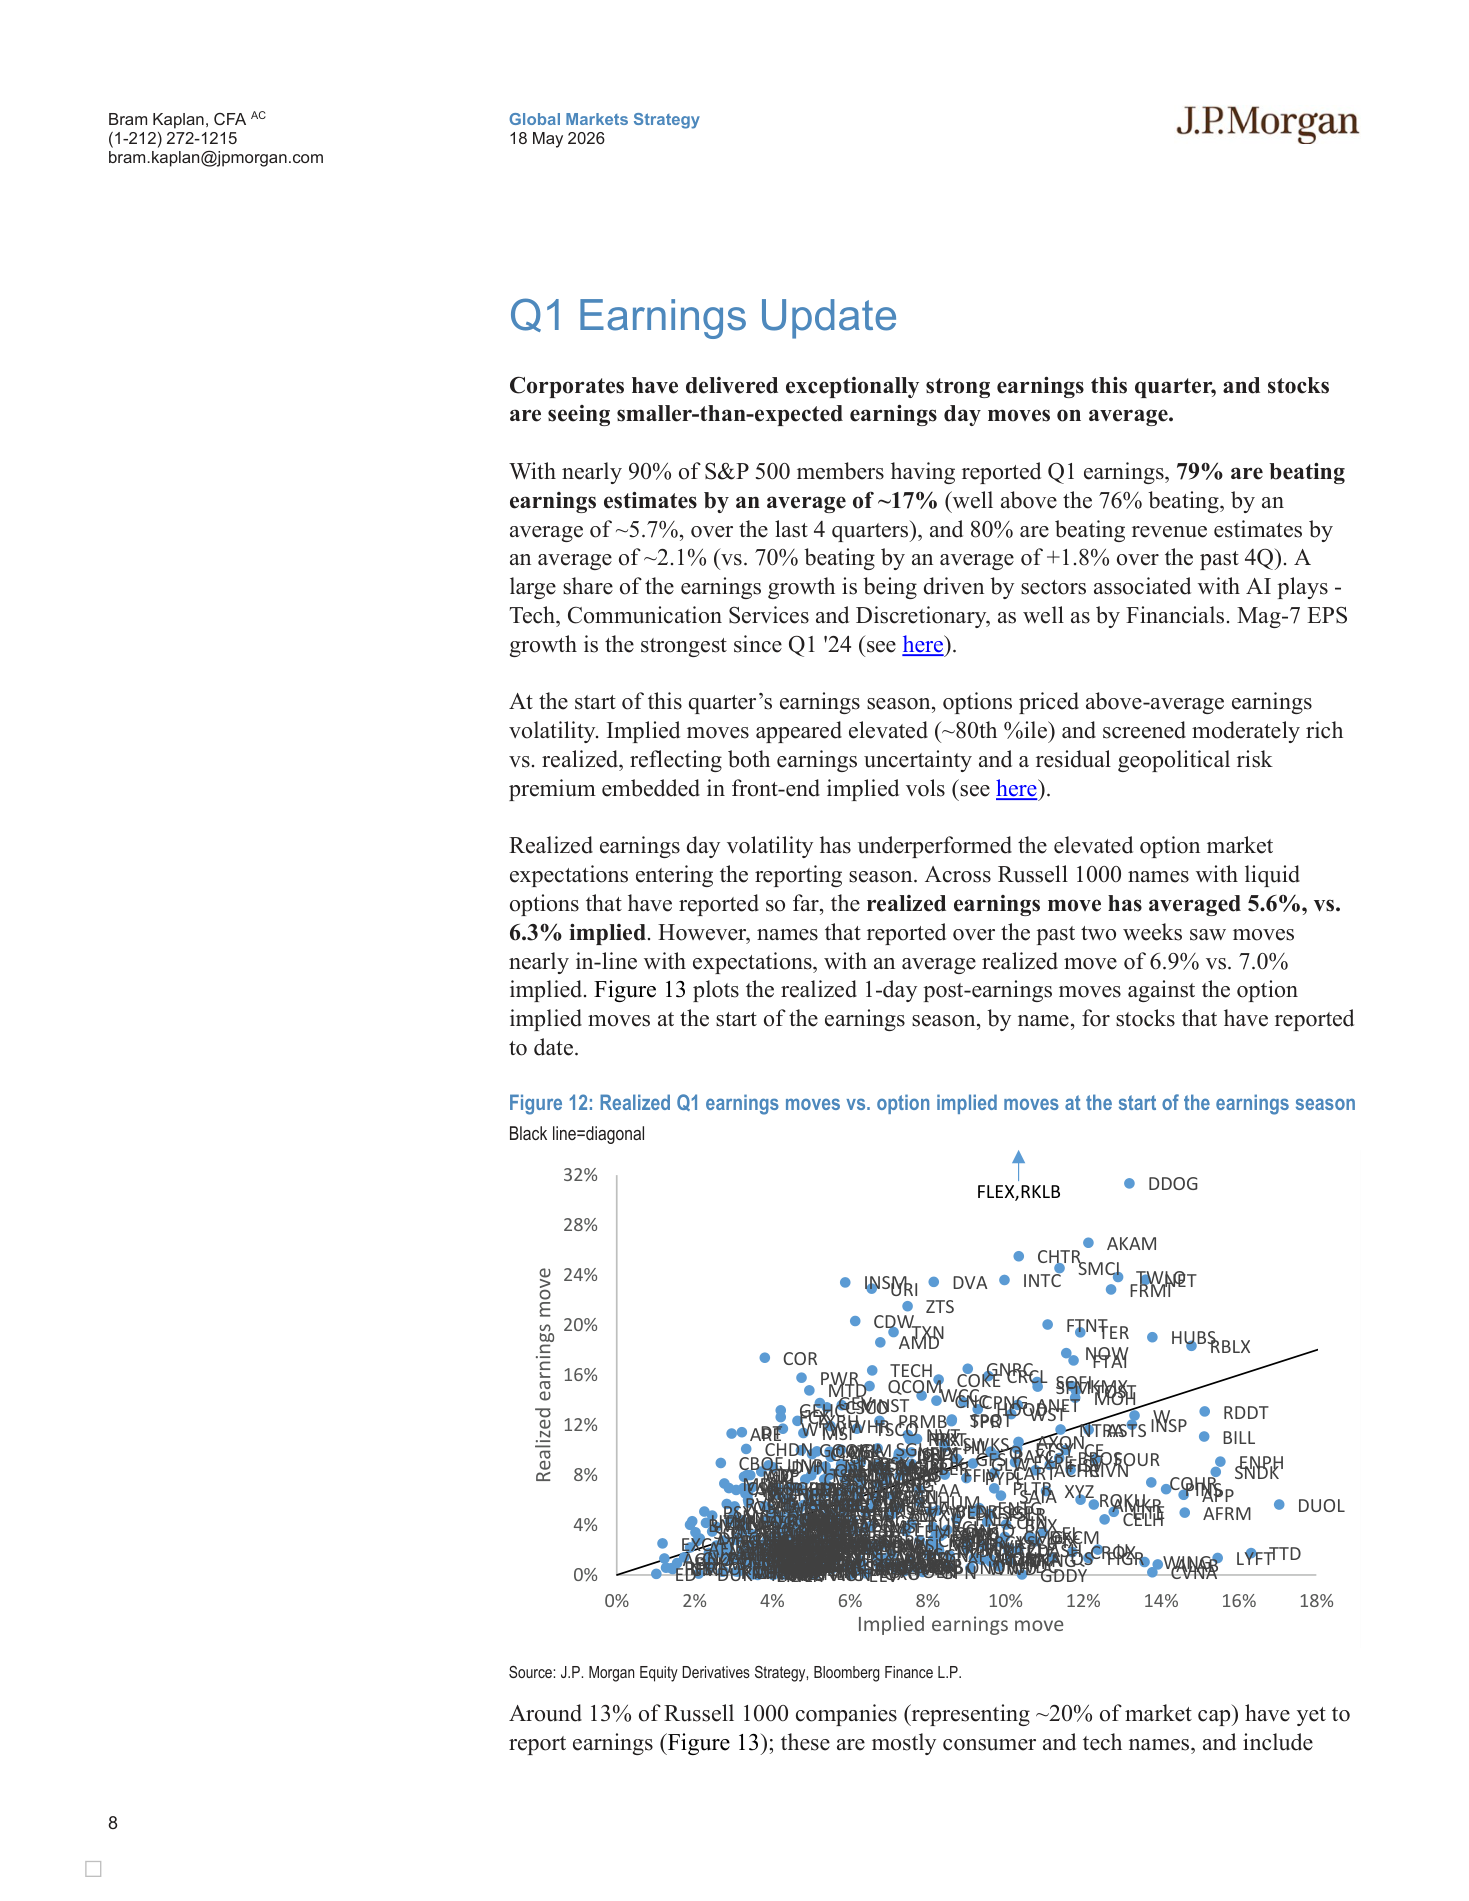
Page 8 | page-fallback | score 1.000
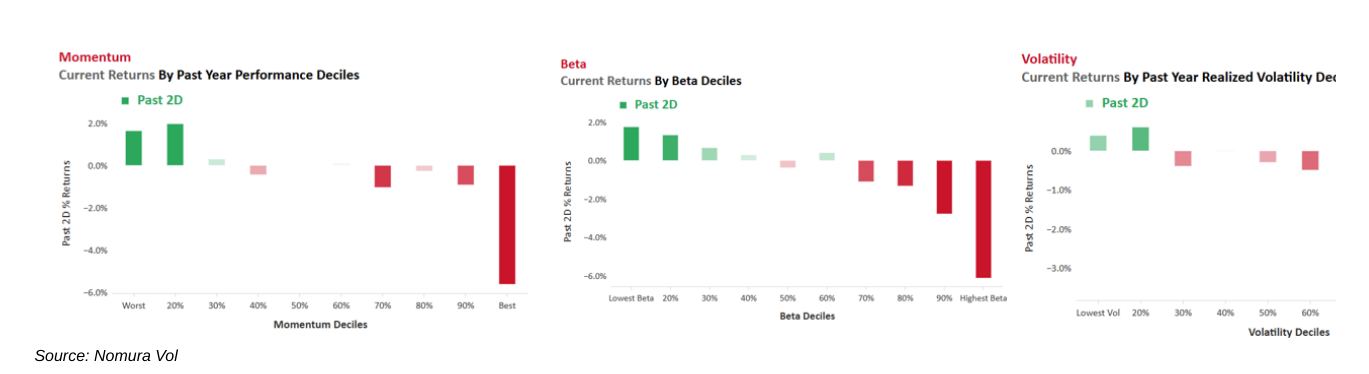
GS CHART OF THE DAY - Record Two-Day Unwind in Momentum
3 additional extracted charts
Chart 1
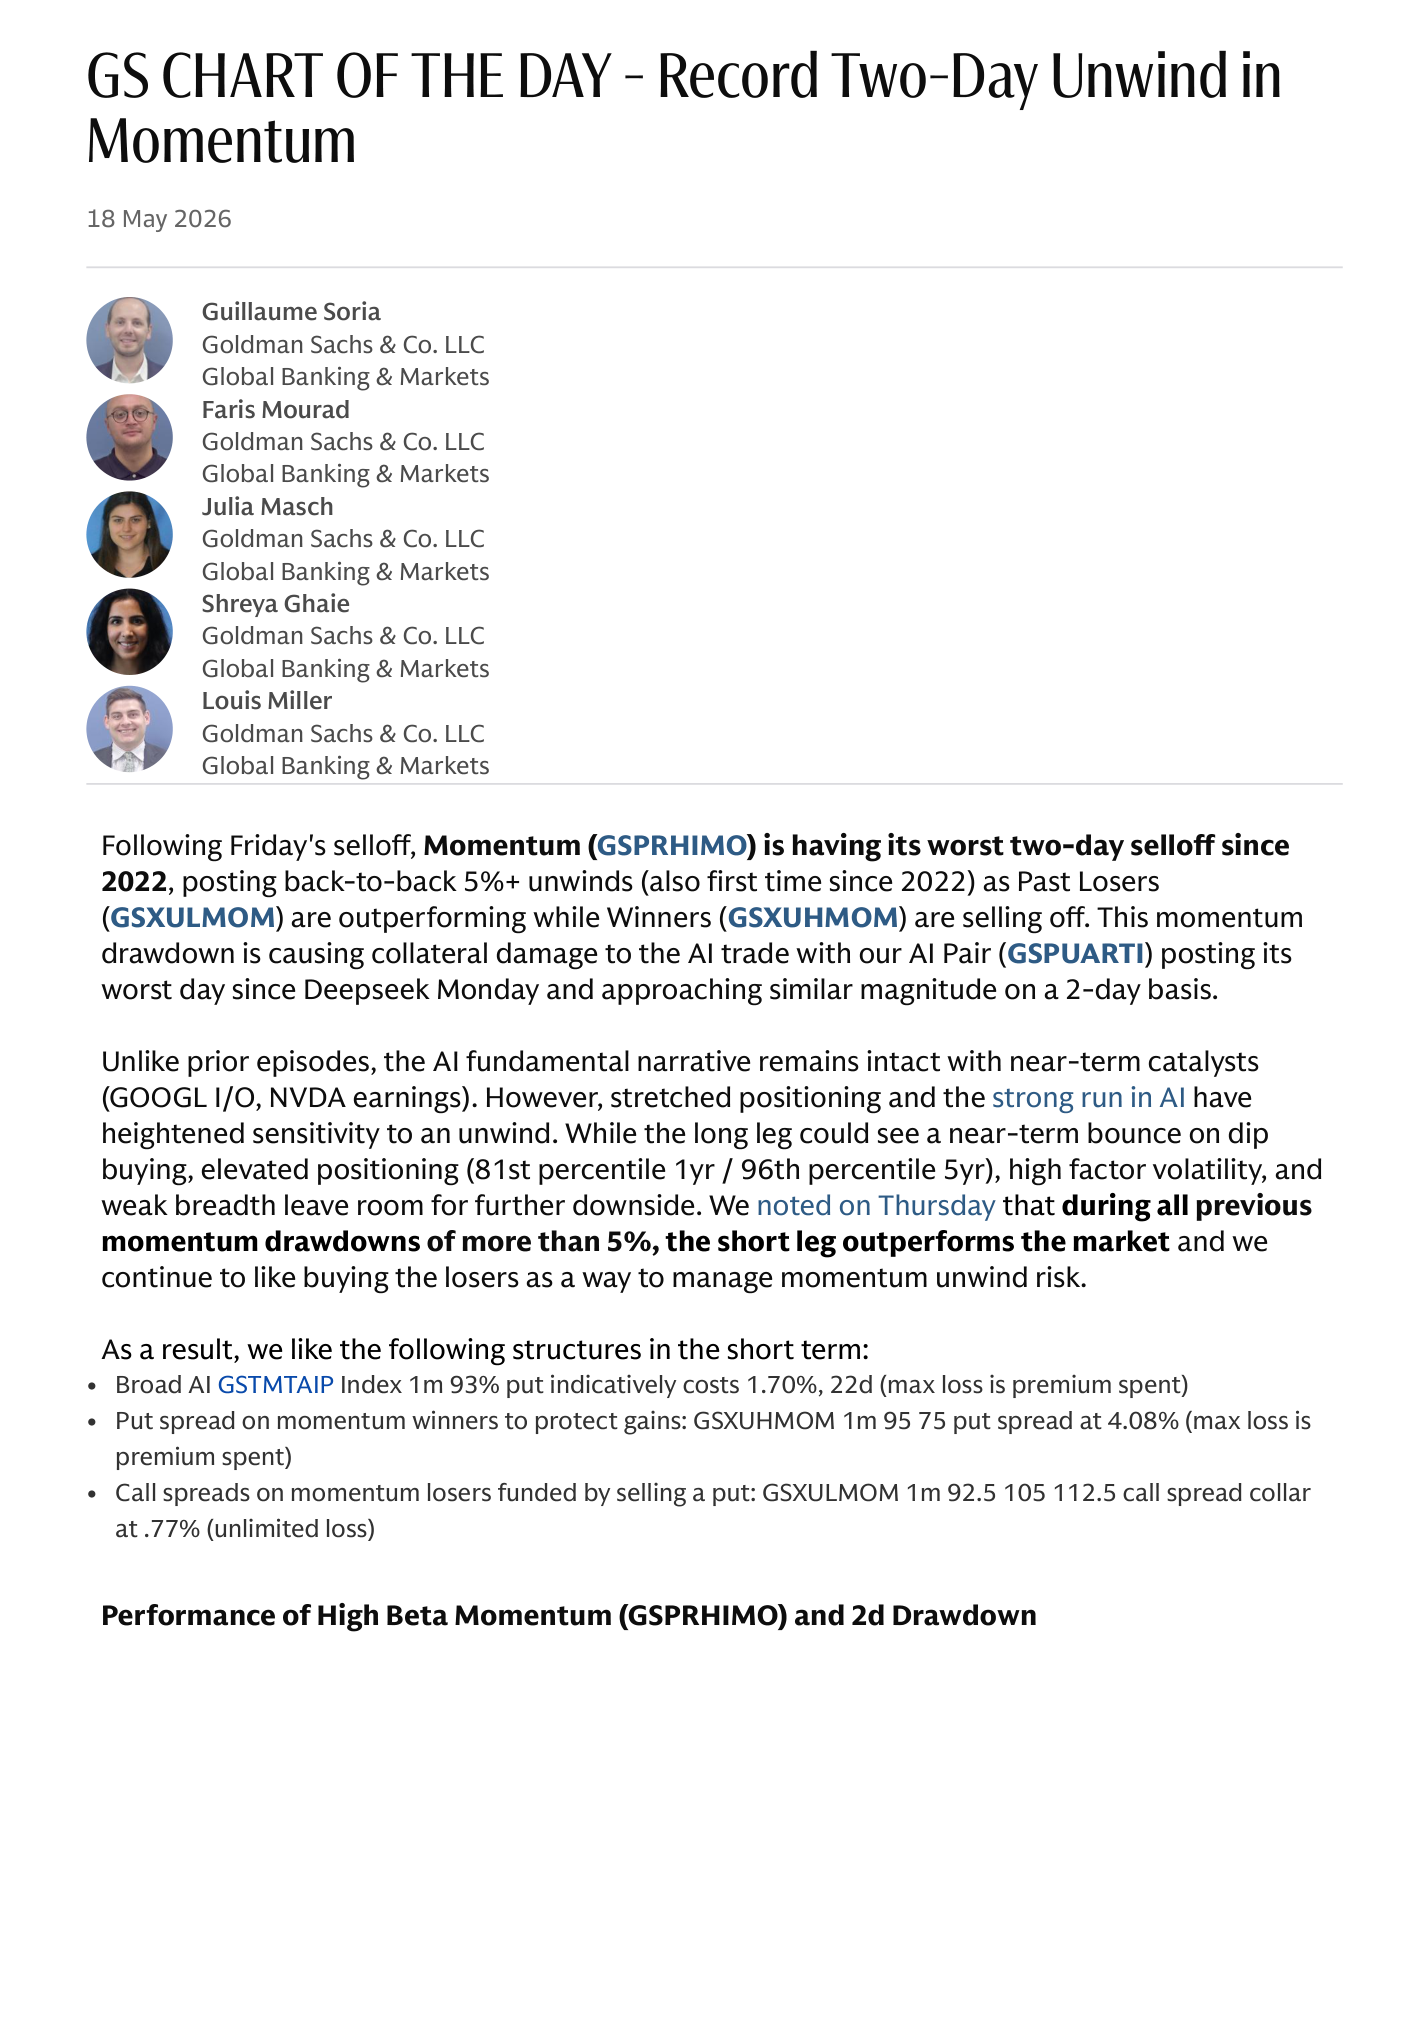
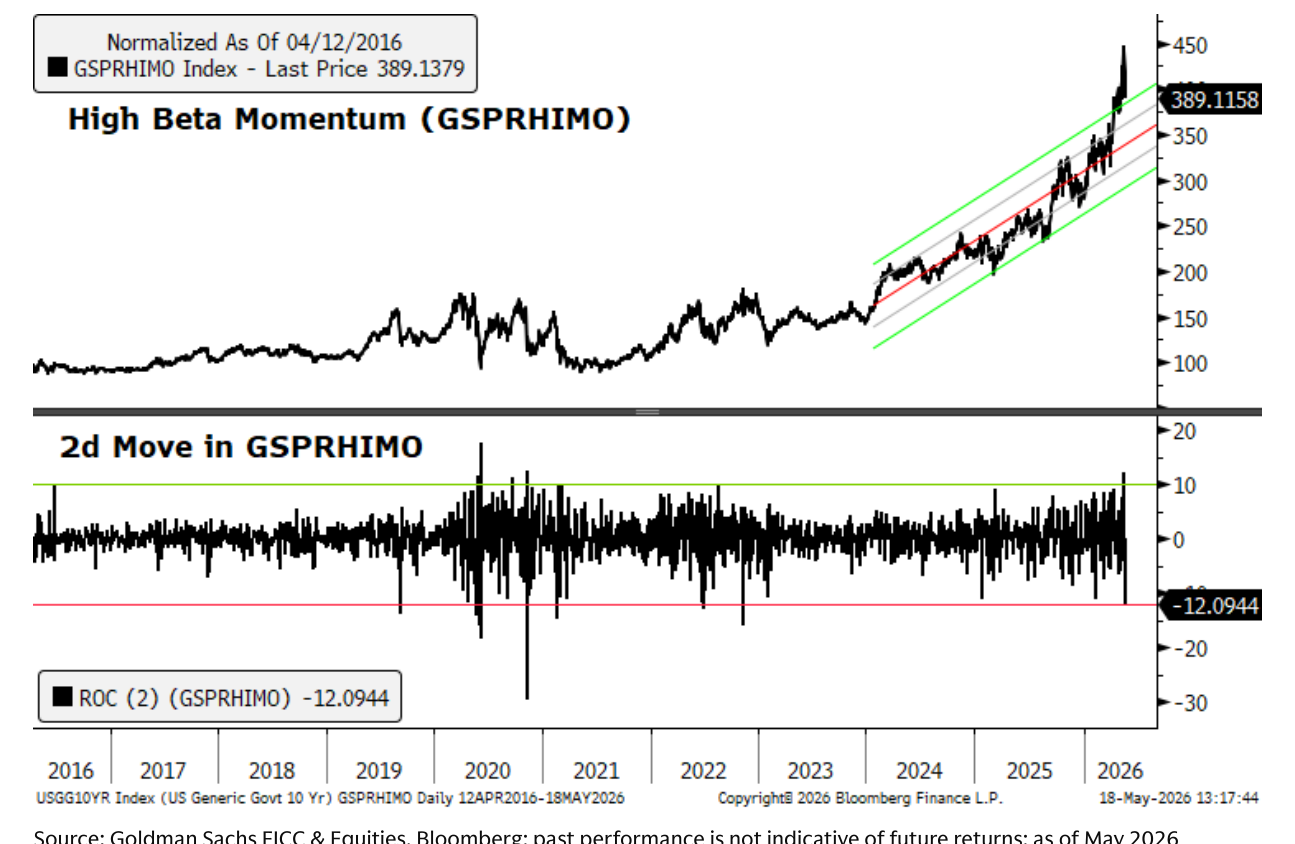
Page 1 | vector-cluster | score 0.712
Chart 2
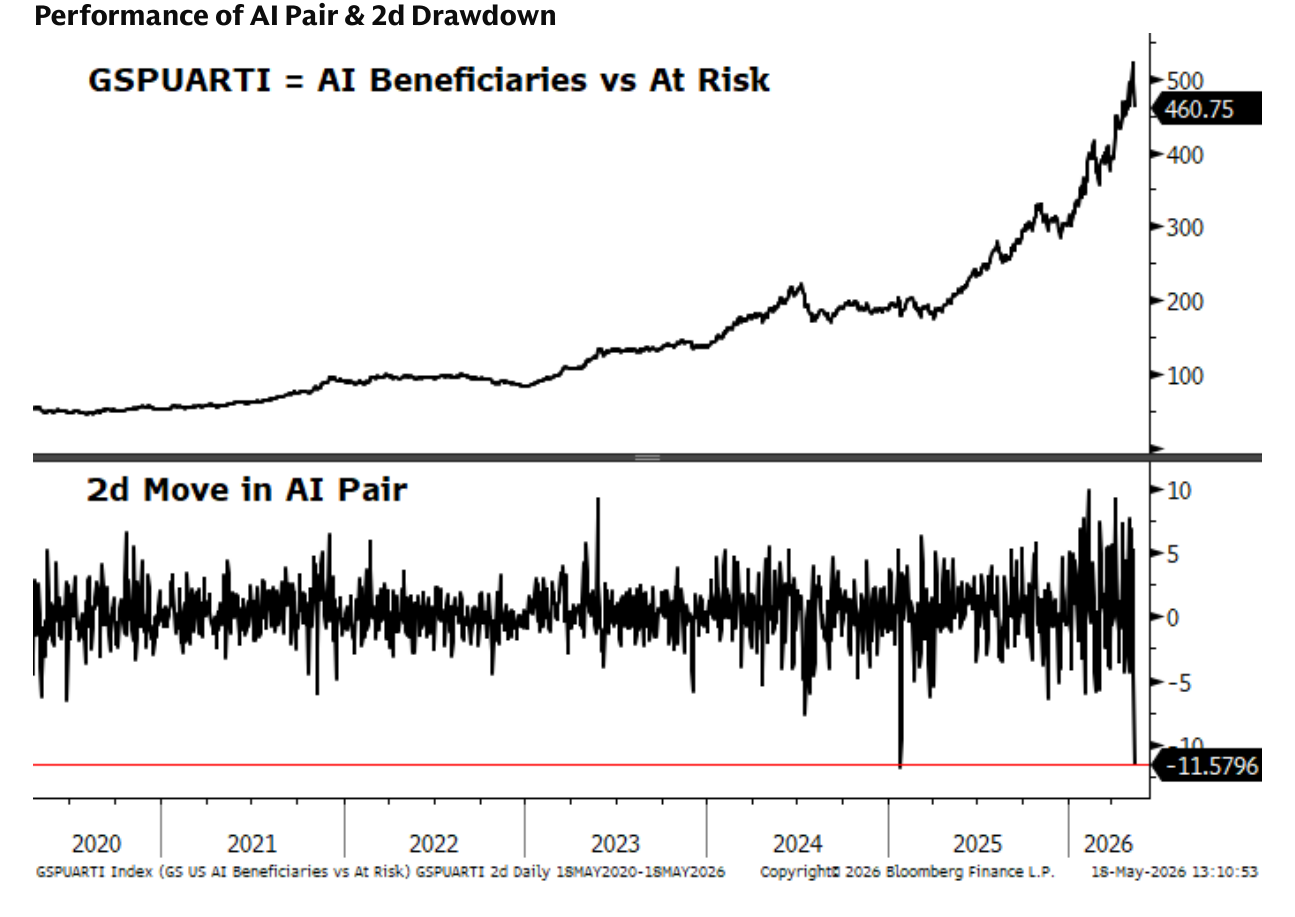
Page 2 | image-block | score 0.709
Chart 3
Page 2 | image-block | score 0.661
JPM Delta One Flows Positioning Rates futures selling pressures
3 additional extracted charts
Chart 1
Page 11 | page-fallback | score 0.887
Chart 2
Page 12 | vector-cluster | score 0.800
Chart 3
Page 14 | vector-cluster | score 0.855
Eq Positioning and Key Levels
2 additional extracted charts
Chart 1
Page 7 | image-block | score 0.775
Chart 2
Page 13 | image-block | score 0.721
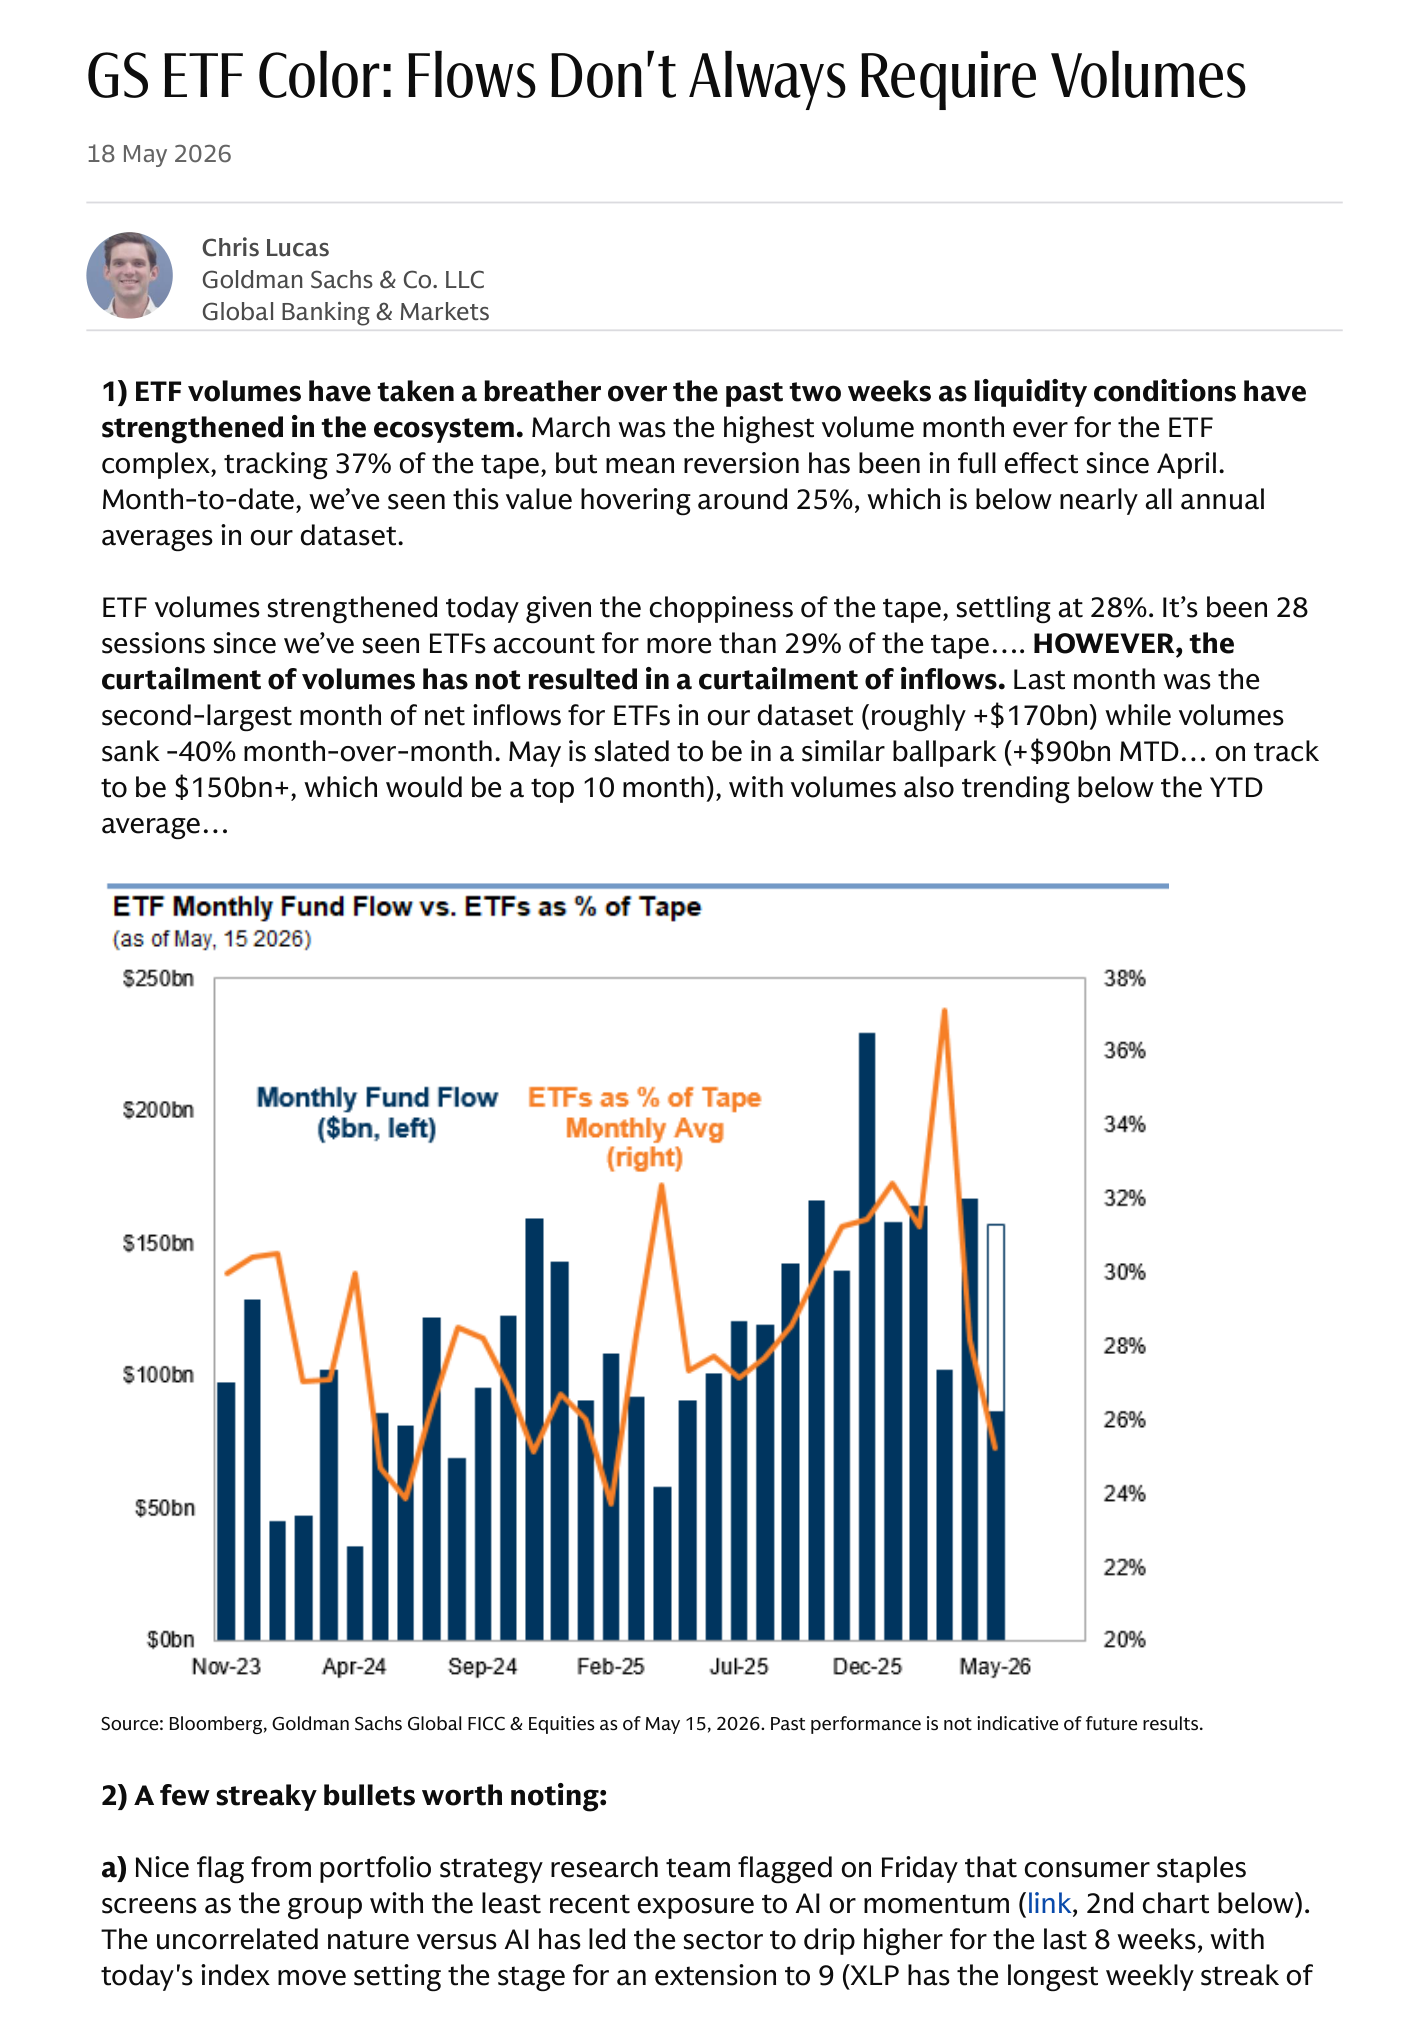
GS ETF Color Flows Don t Always Require Volumes
3 additional extracted charts
Chart 1
Page 1 | image-block | score 0.743
Chart 2
Page 1 | vector-cluster | score 0.730
Chart 3
Page 2 | image-block | score 0.684
Nomura Cross-Asset THE SONG REMAINS THE SAME
3 additional extracted charts
Chart 1
Page 1 | image-block | score 0.488
Chart 2
Page 3 | image-block | score 0.689
Chart 3
Page 3 | image-block | score 0.475
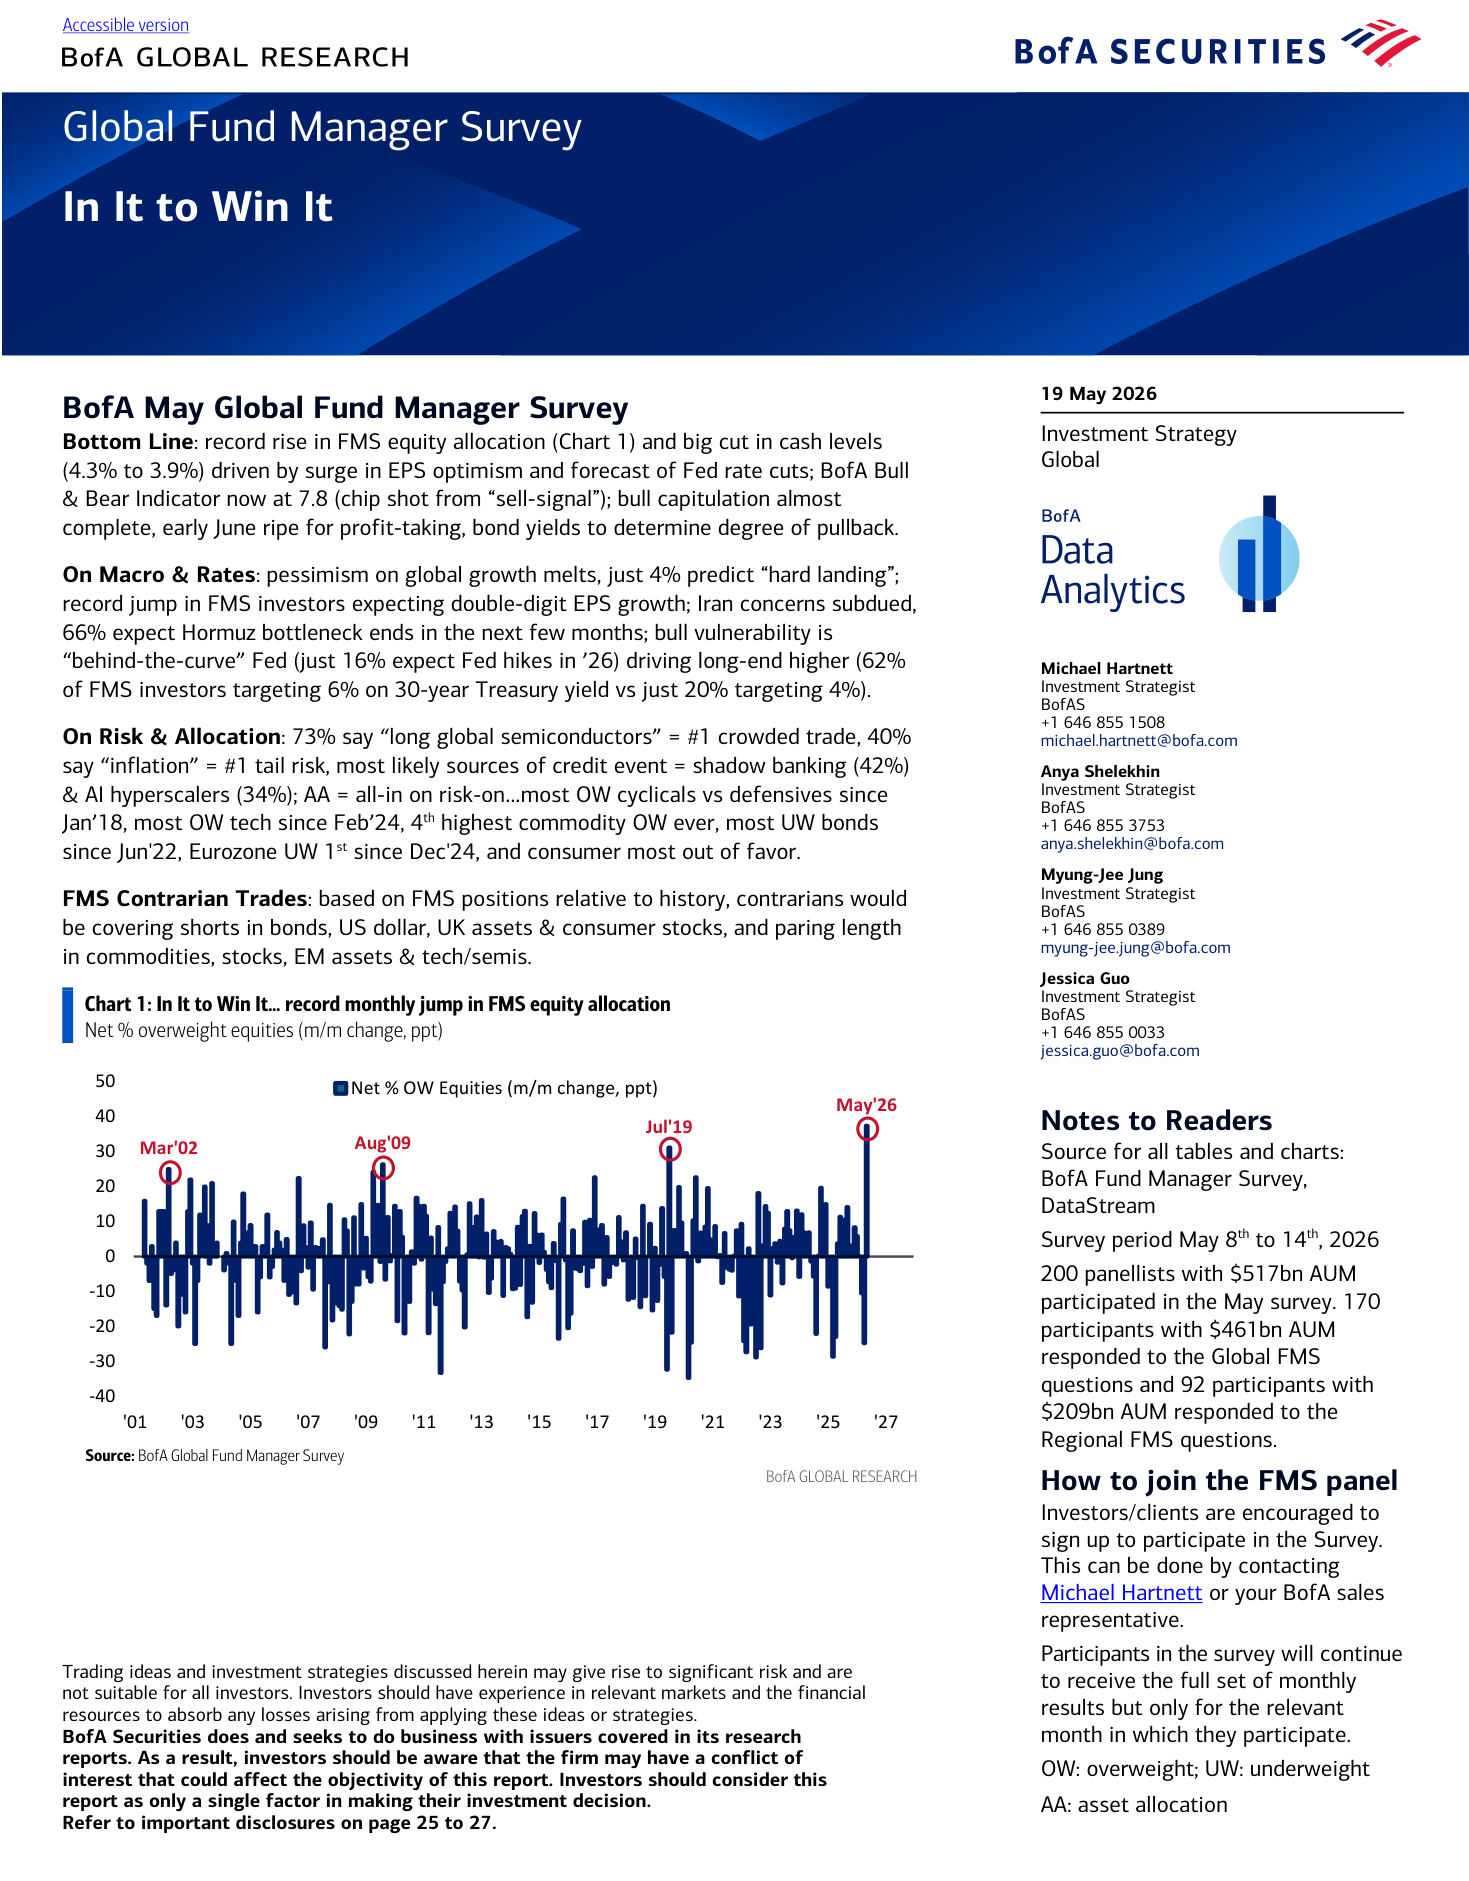
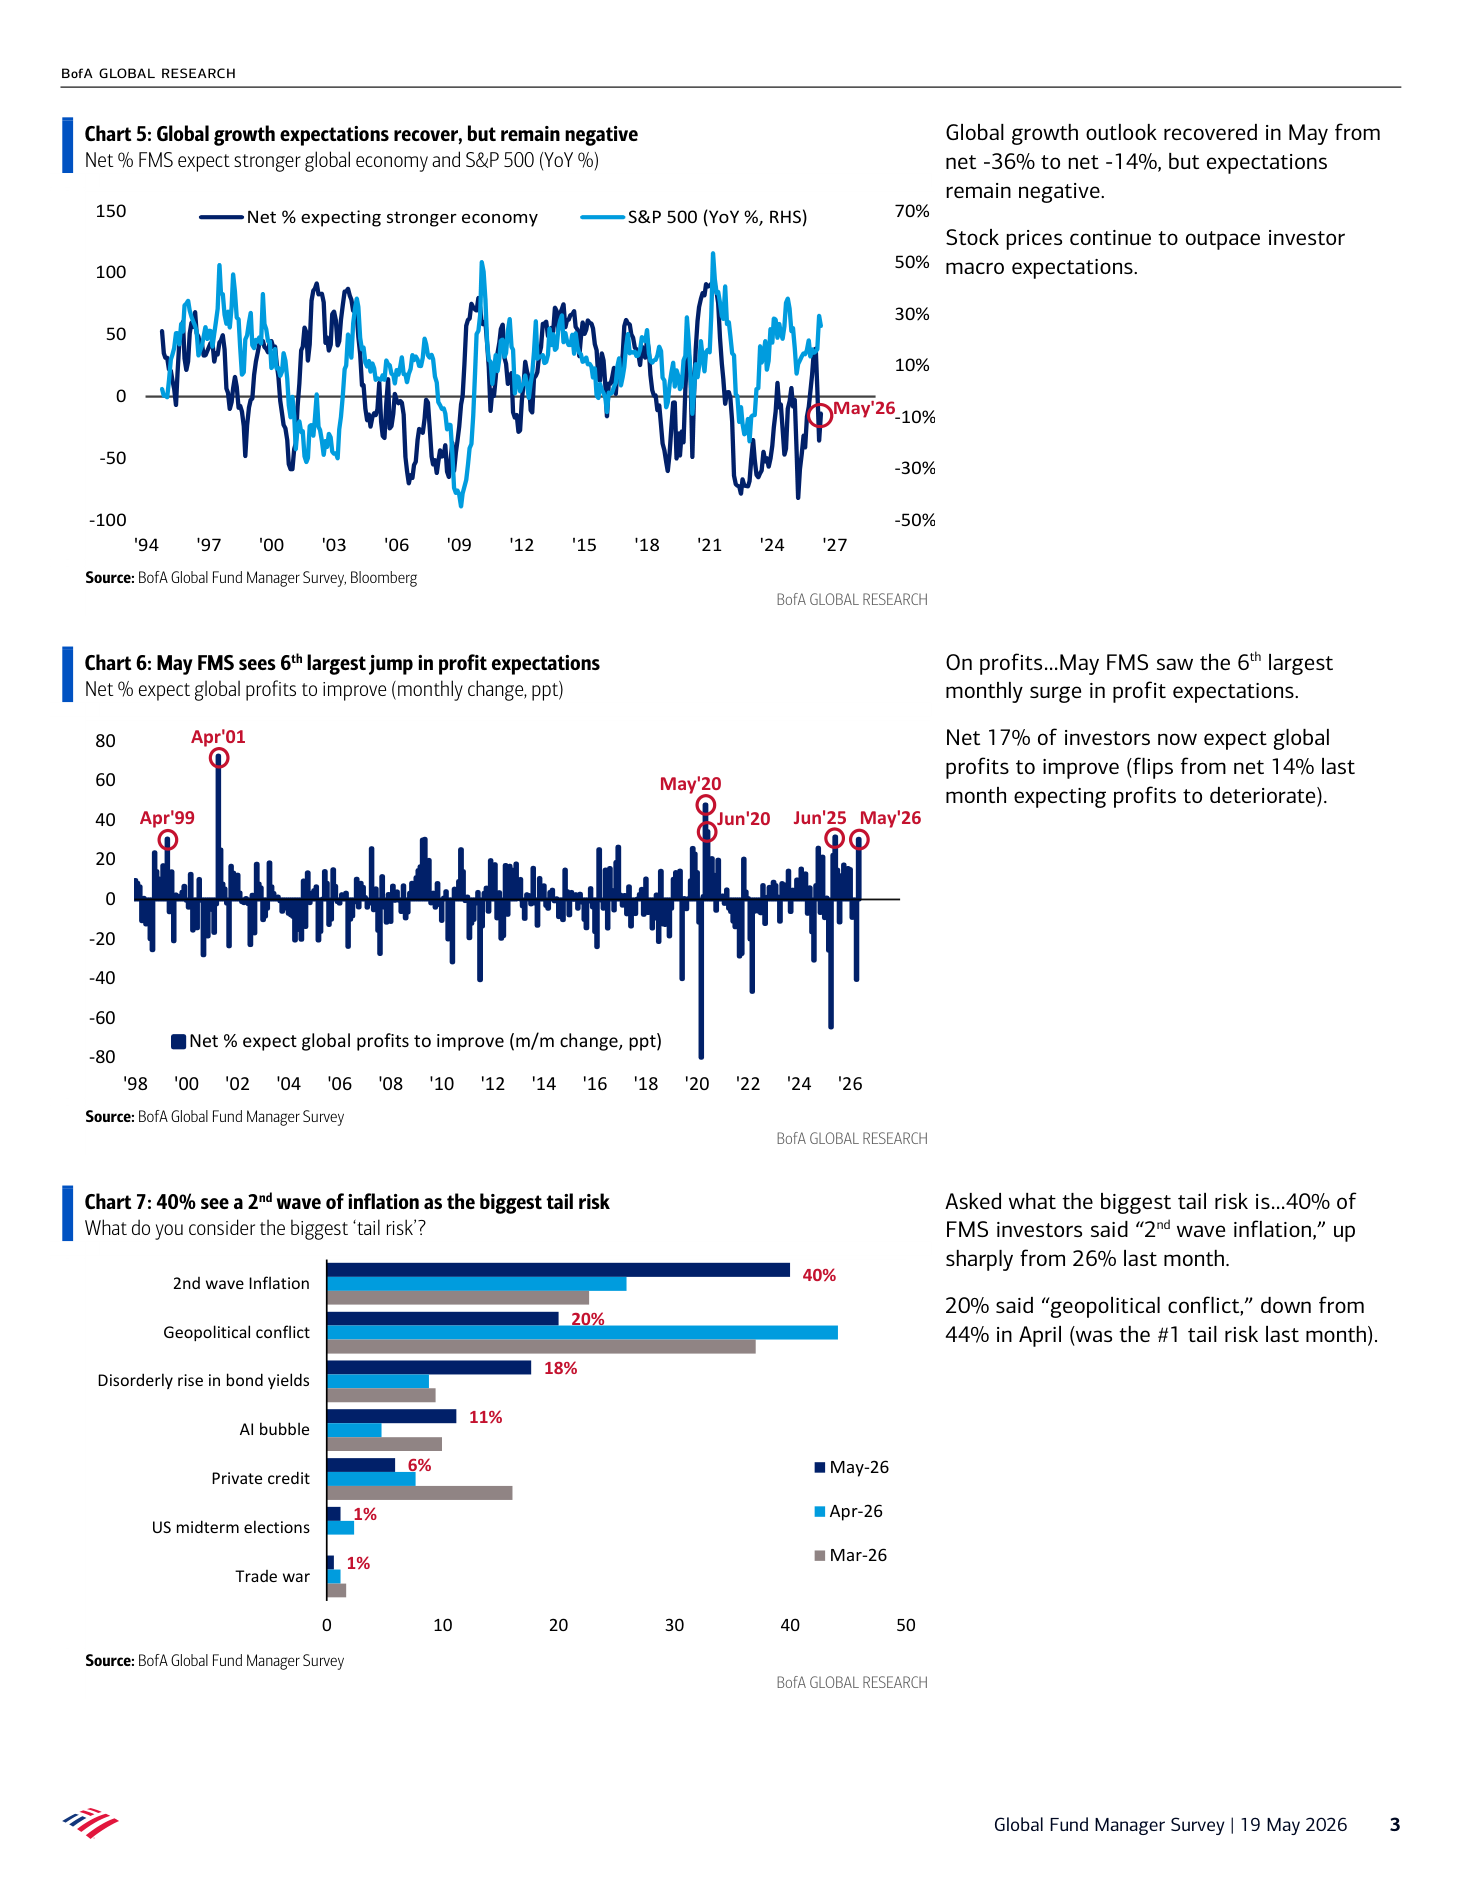
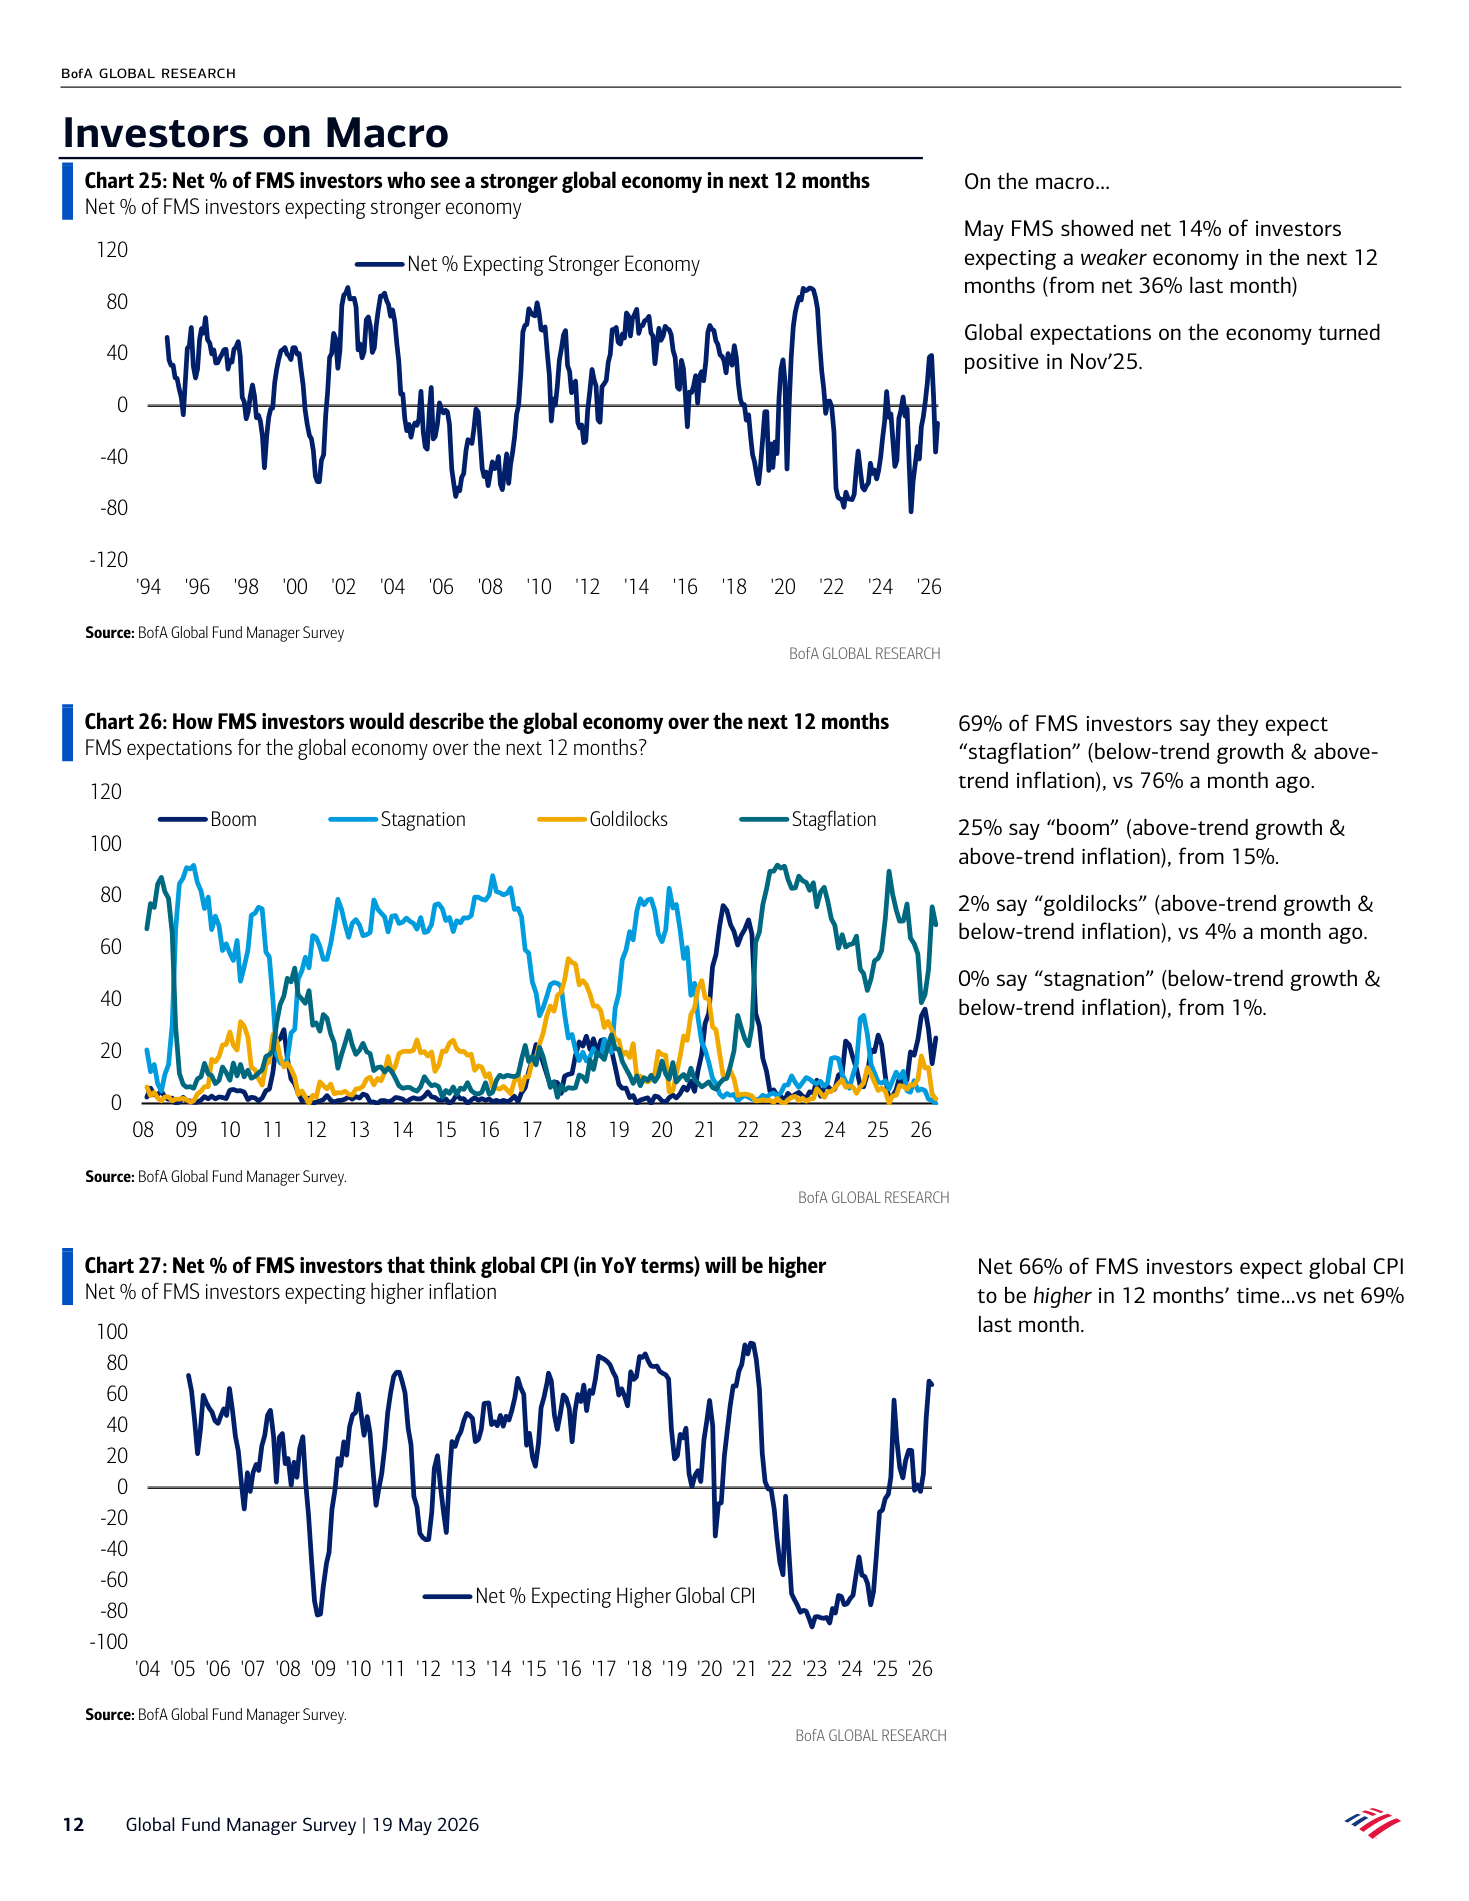
BofA Hartnett Global Fund Manager Survey In It to Win It 20260519
3 additional extracted charts
Chart 1
Page 1 | vector-cluster | score 1.100
Chart 2
Page 3 | page-fallback | score 1.000
Chart 3
Page 12 | page-fallback | score 1.000
we were ready to increase our short then these charts showed up
2 additional extracted charts
Chart 1
Page 2 | vector-cluster | score 0.773
Chart 2
Page 3 | vector-cluster | score 0.664
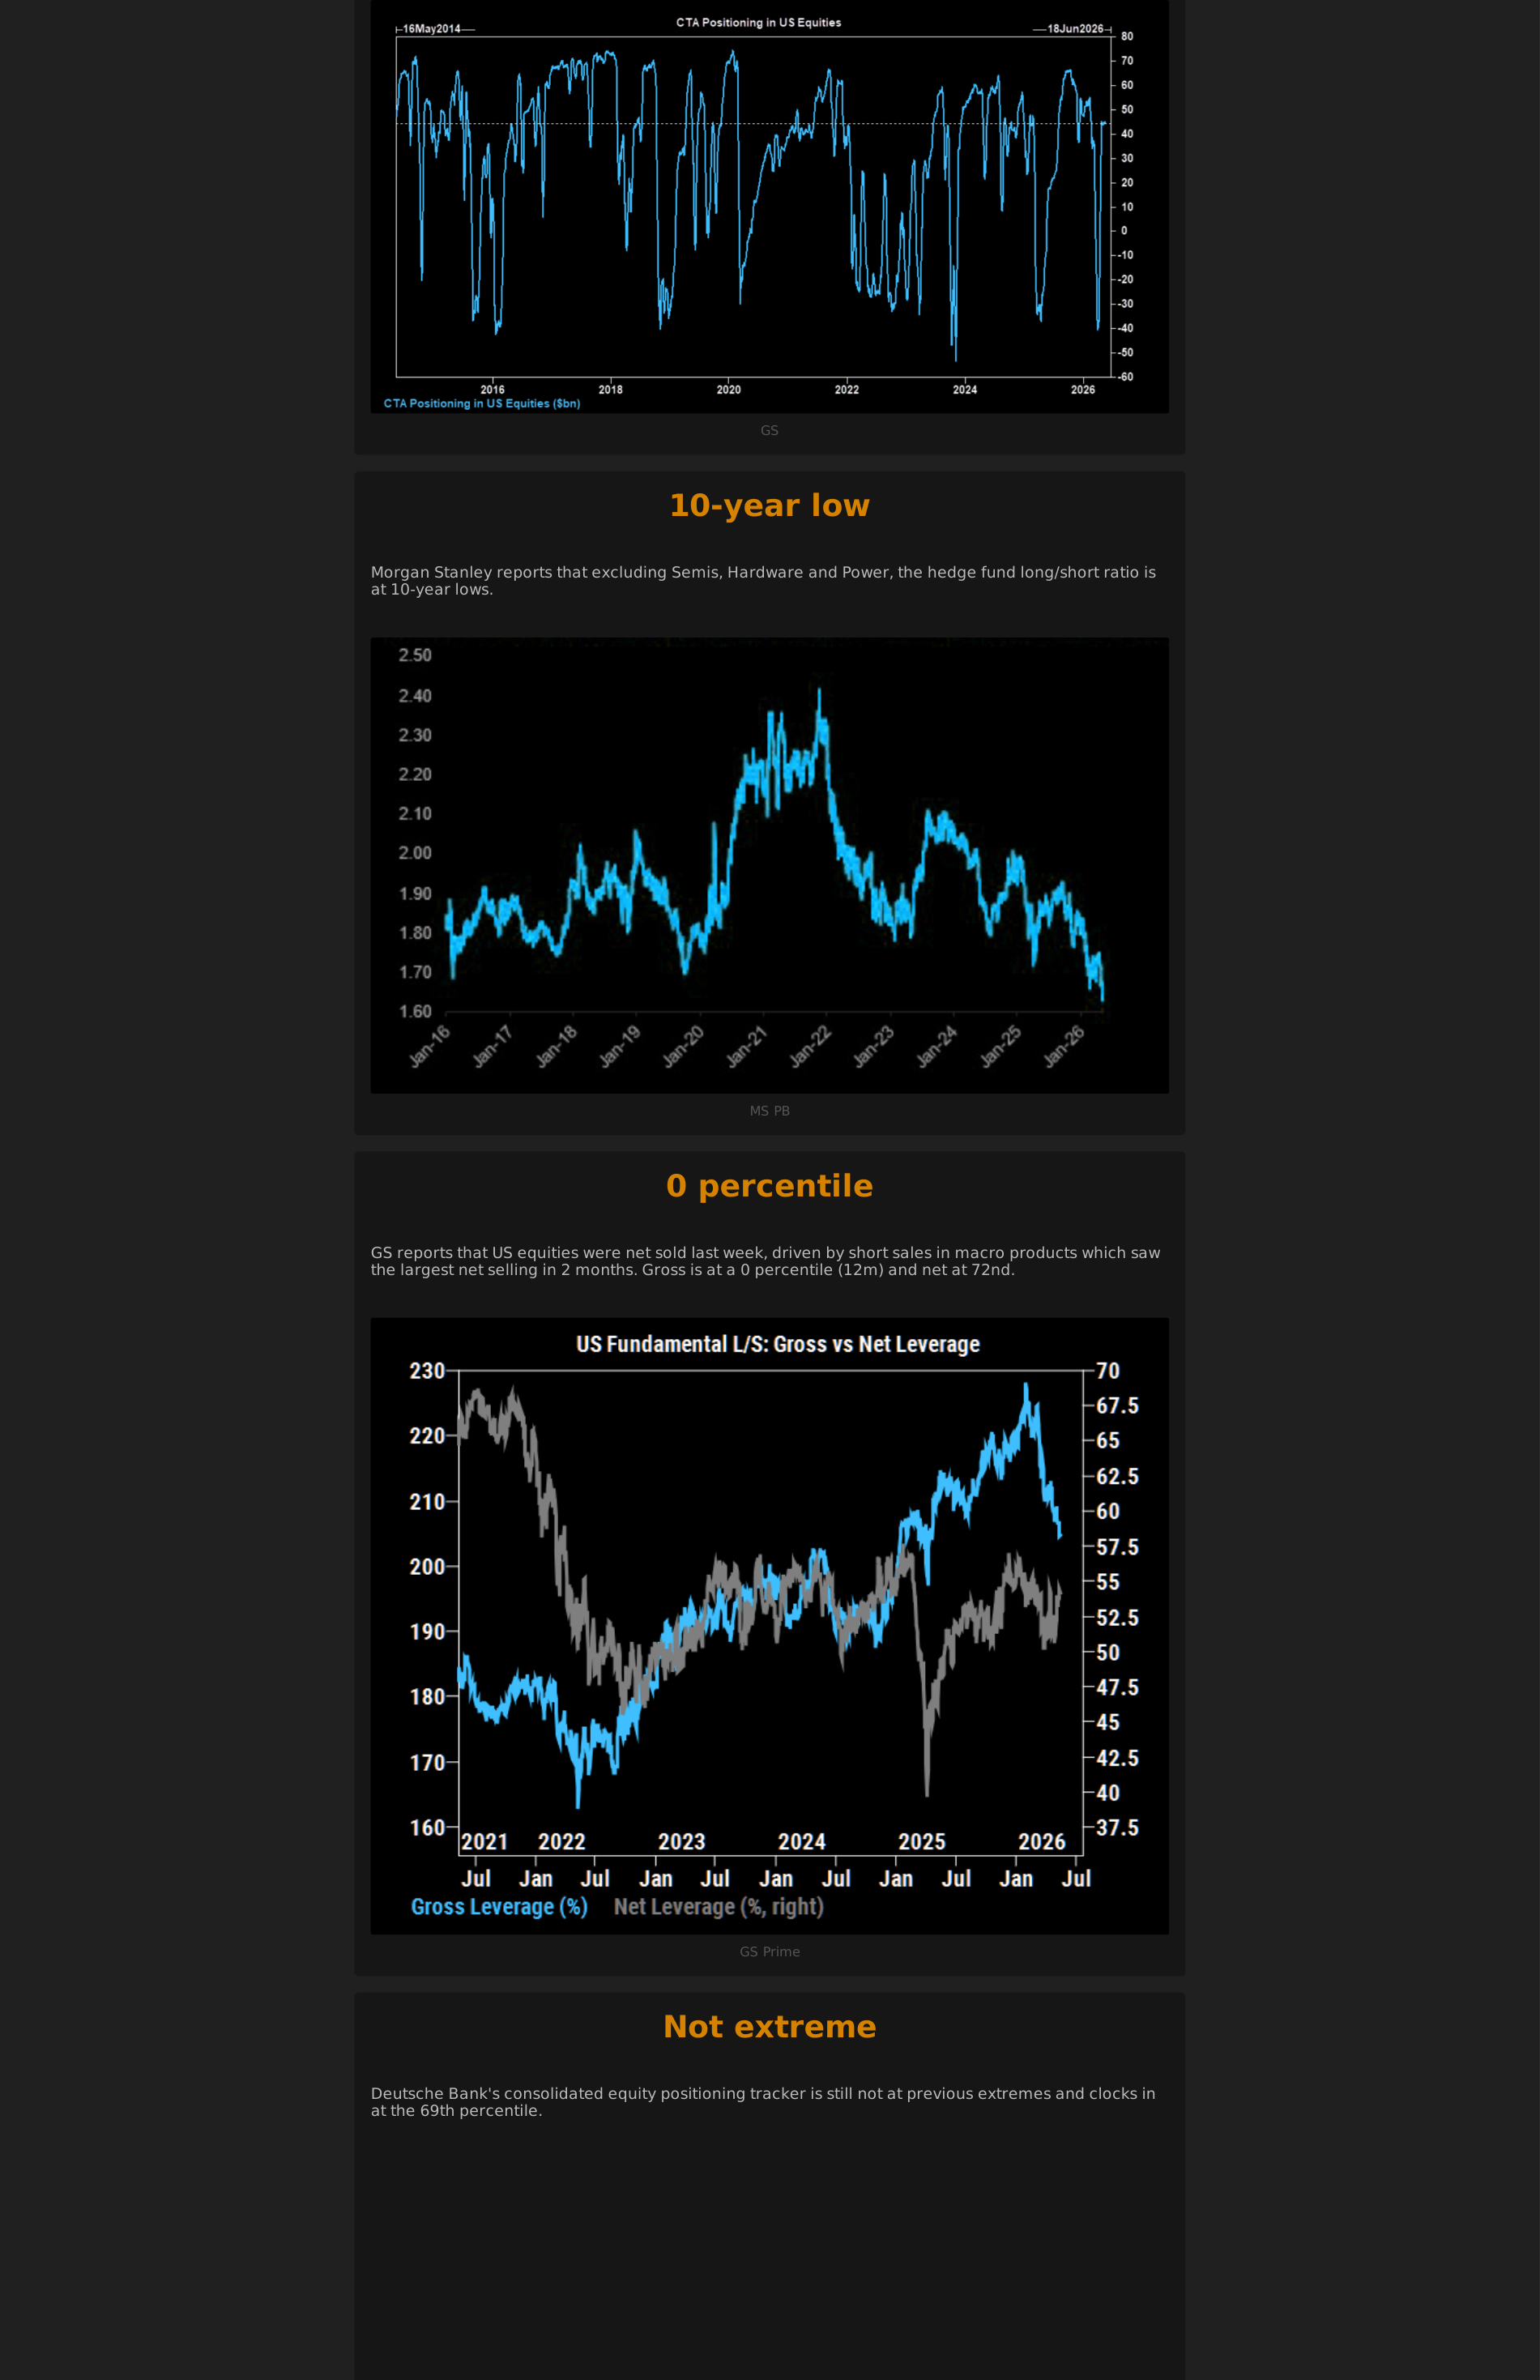
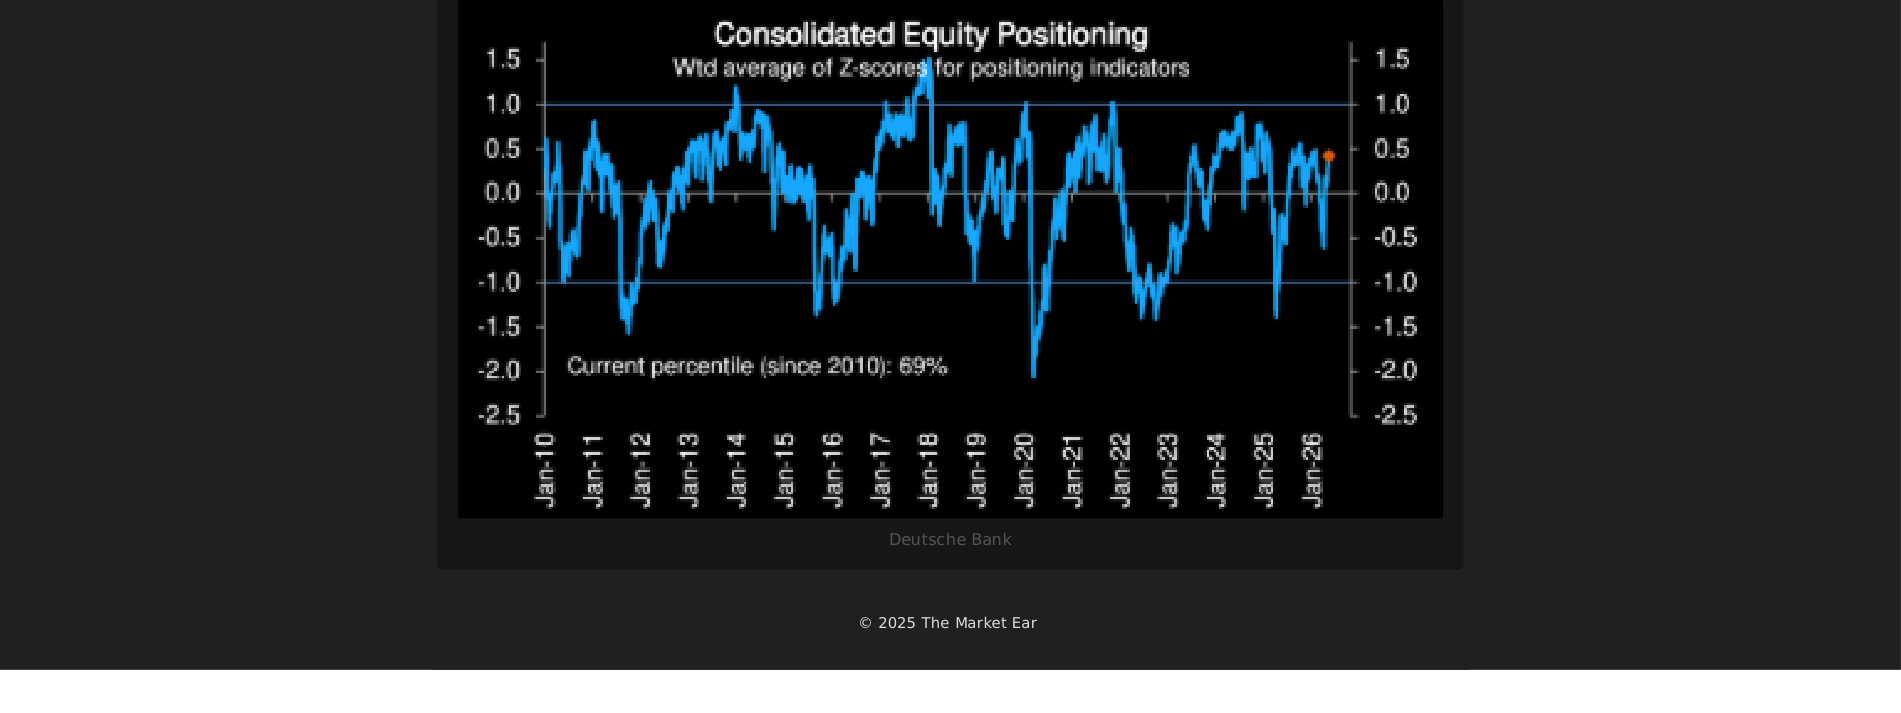
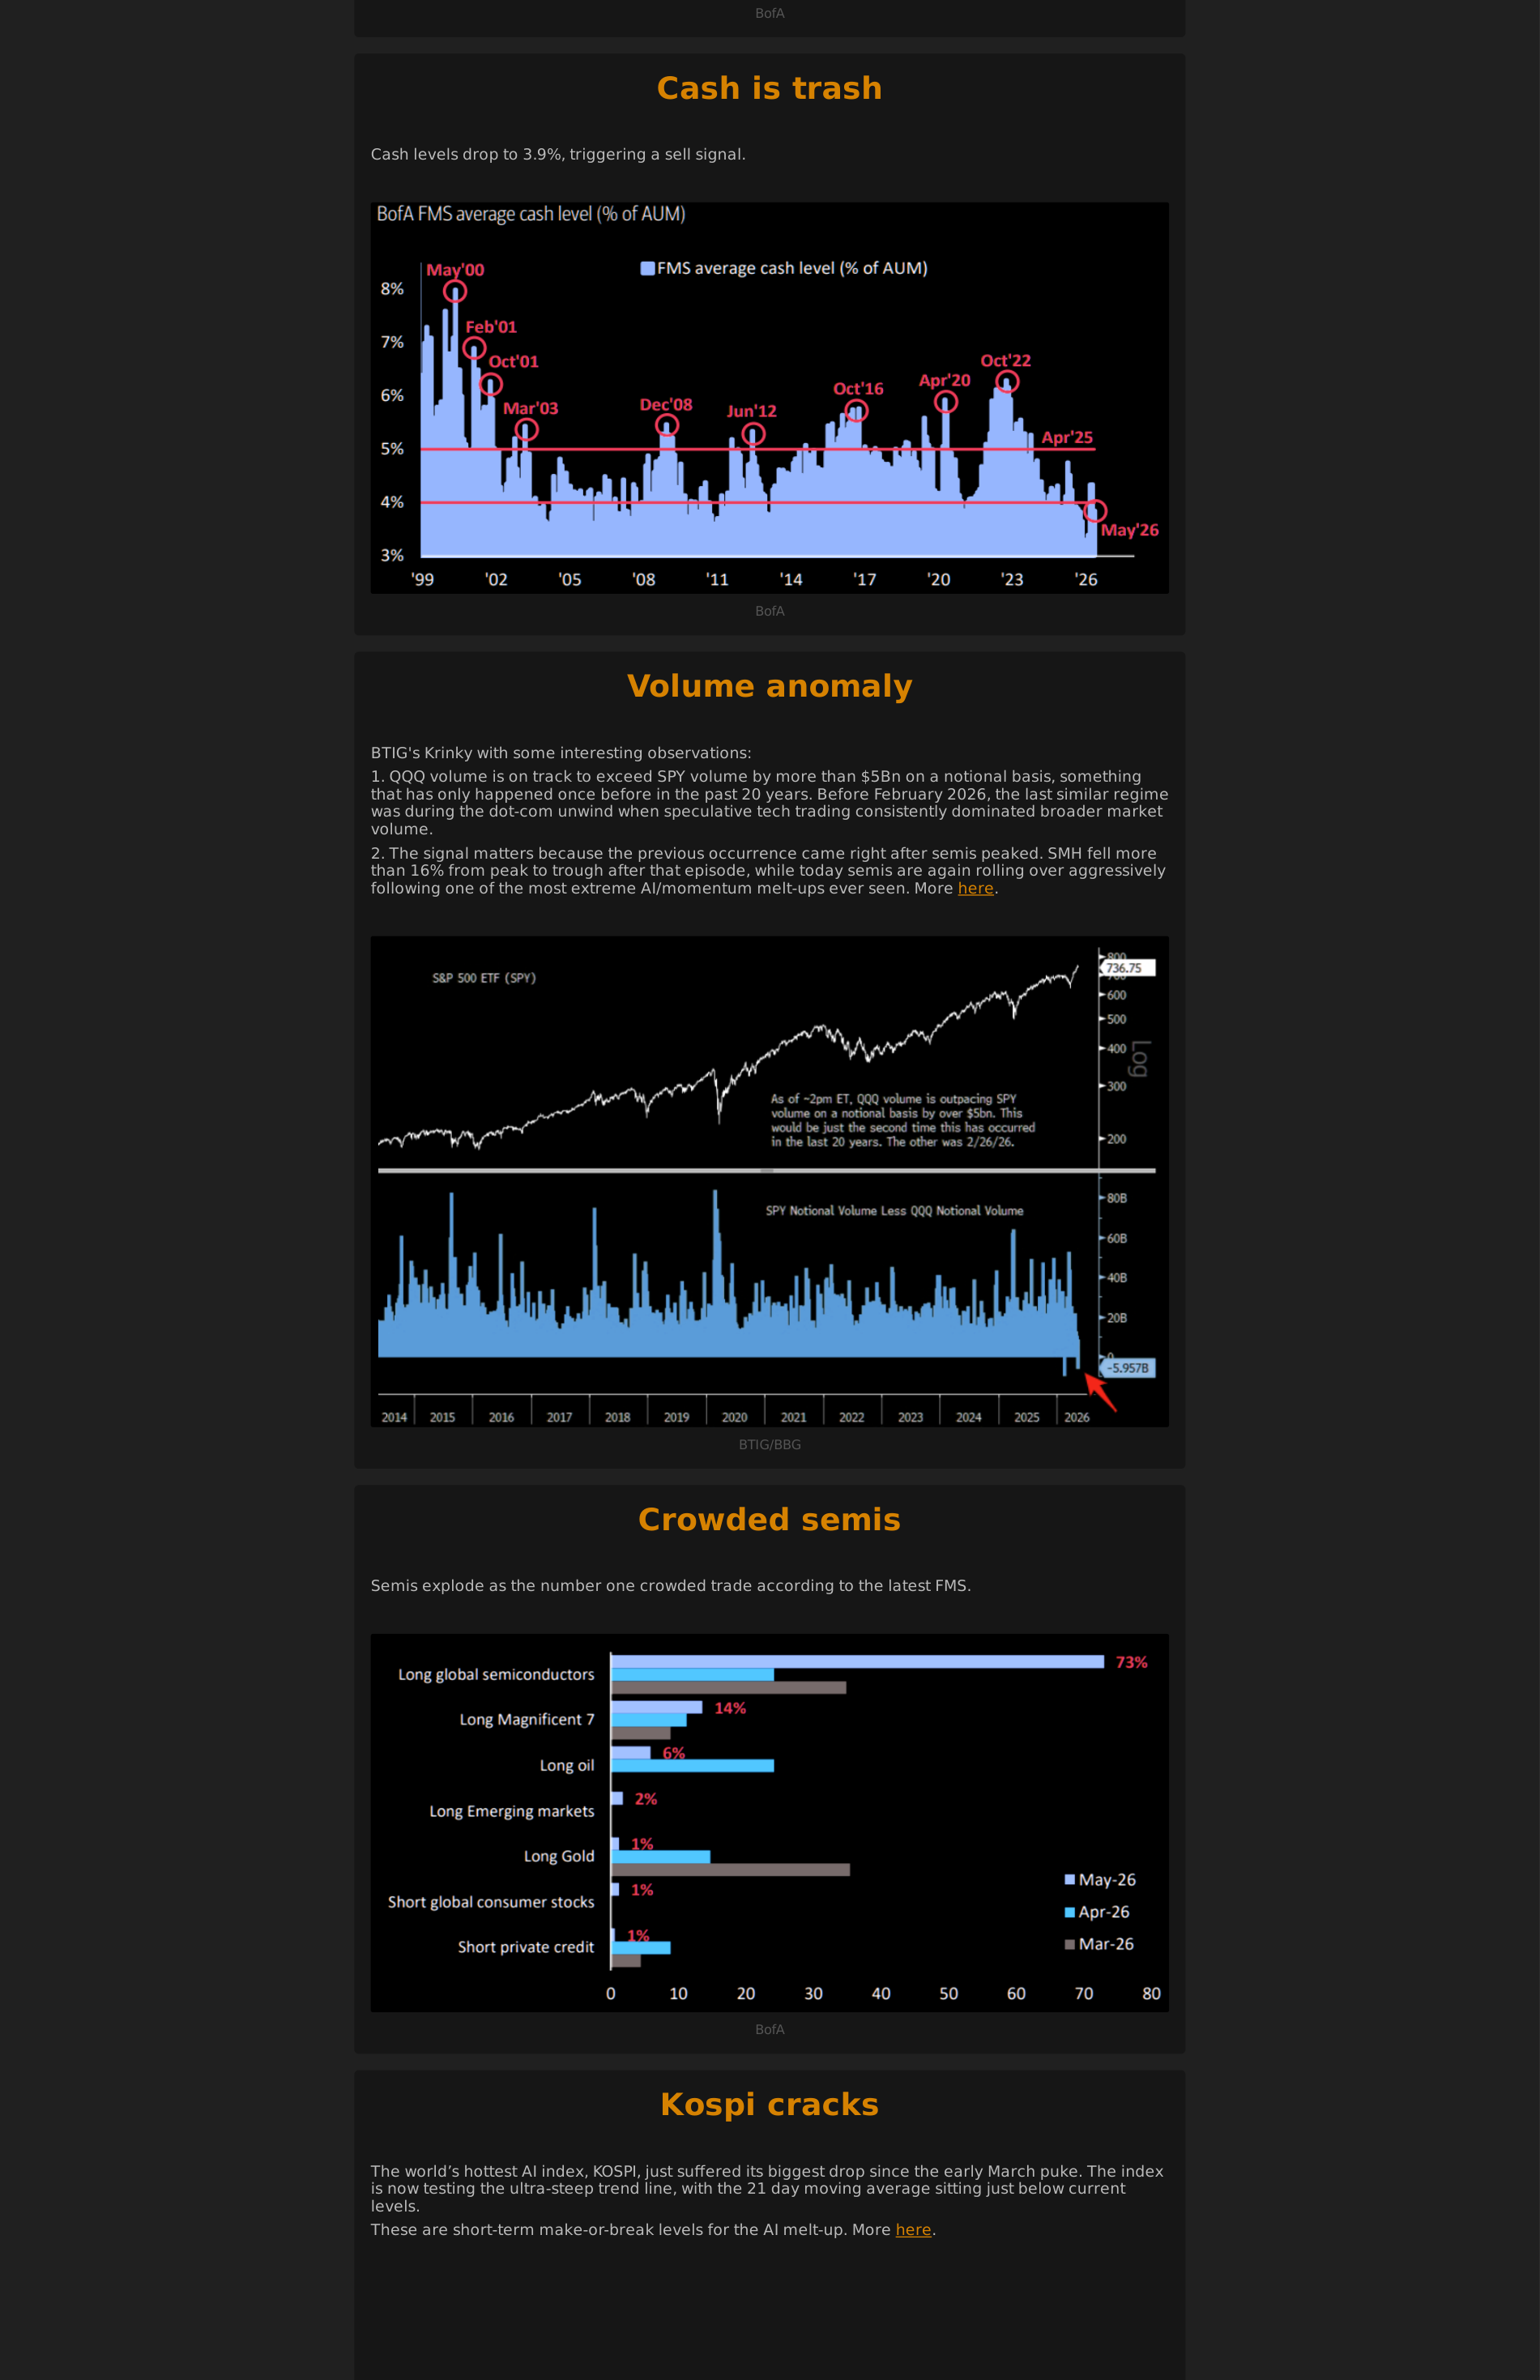
the most crowded trade on earth is cracking
3 additional extracted charts
Chart 1
Page 1 | vector-cluster | score 0.712
Chart 2
Page 2 | vector-cluster | score 0.807
Chart 3
Page 3 | vector-cluster | score 0.713
The Bond Market Is Starting To Break The AI Melt-Up
2 additional extracted charts
Chart 1
Page 1 | vector-cluster | score 0.734
Chart 2
Page 2 | vector-cluster | score 0.744
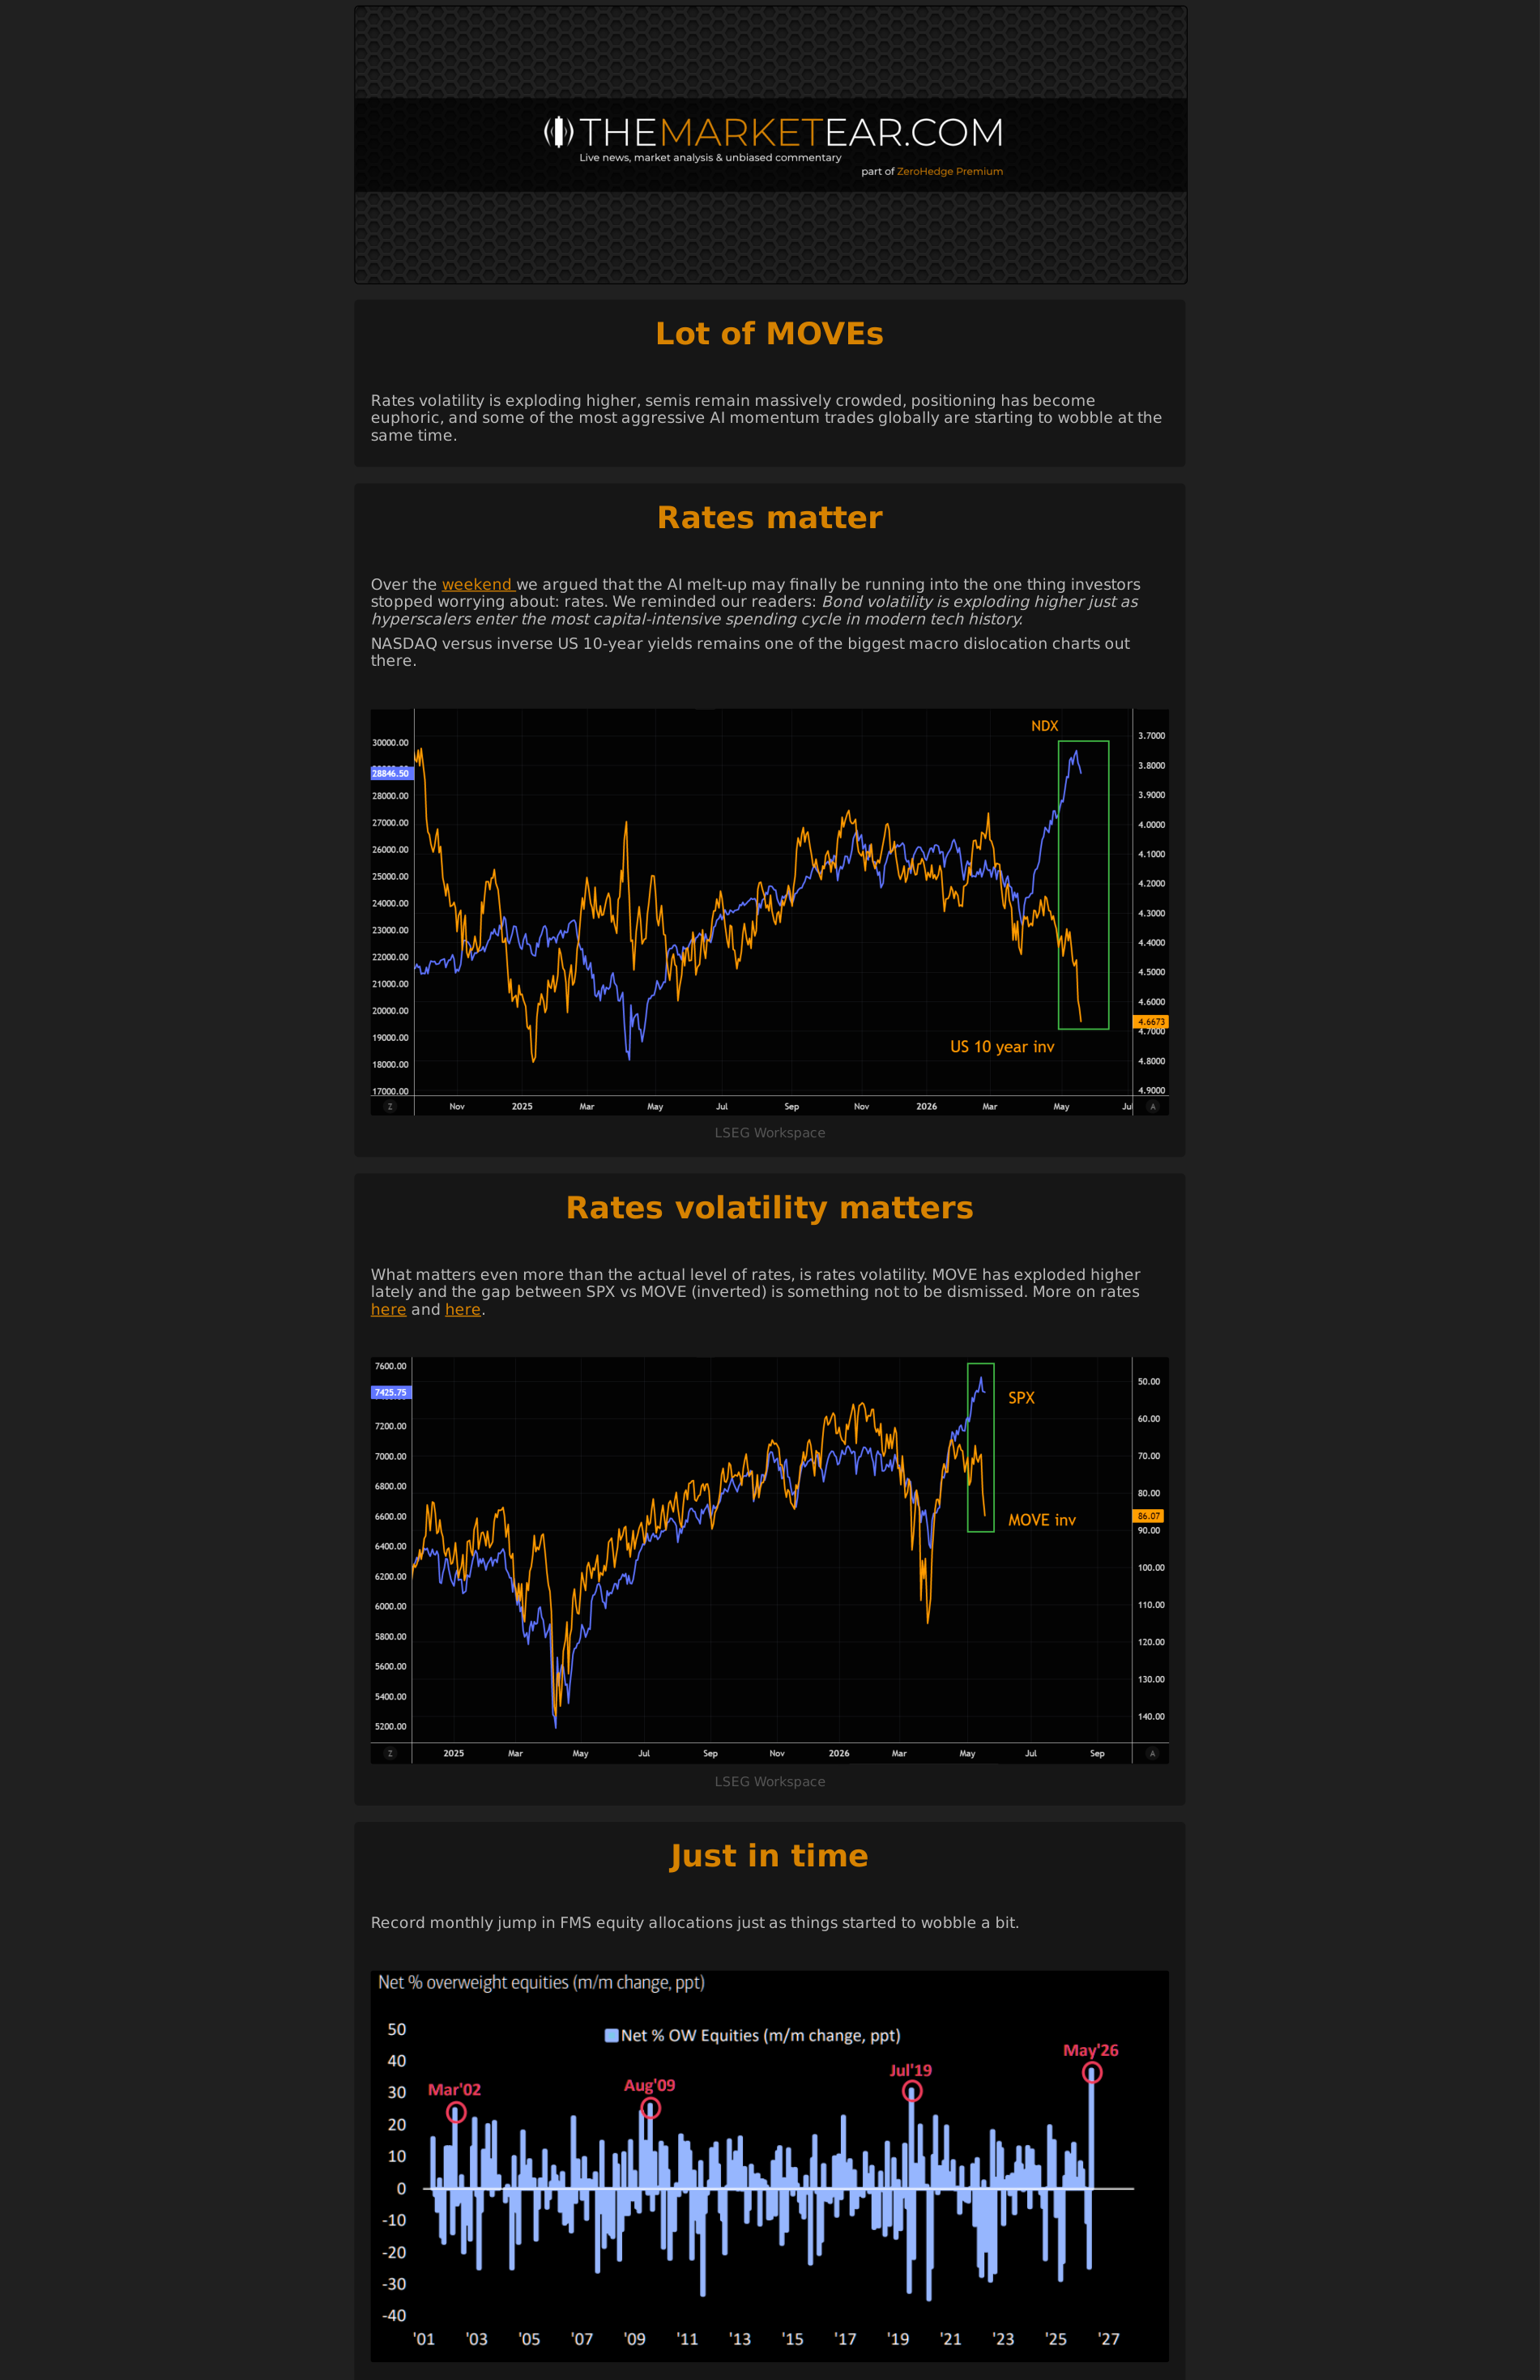
lot of moves
3 additional extracted charts
Chart 1
Page 1 | vector-cluster | score 0.654
Chart 2
Page 2 | vector-cluster | score 0.935
Chart 3
Page 3 | vector-cluster | score 0.766
Jamie Dimon s Favorite FX Brain Is Buying Dollars Again