Trading_and_investment_papers plus Daily Shot when available.
Window PDFs10
Chart Extracts30
Top Charts4
Daily Shotskipped
Bottom line: This packet is the one-stop morning read: curated chart evidence first, Daily Shot context second, and source links at the end.
Top Charts
1. Earnings are still carrying more weight than bears want
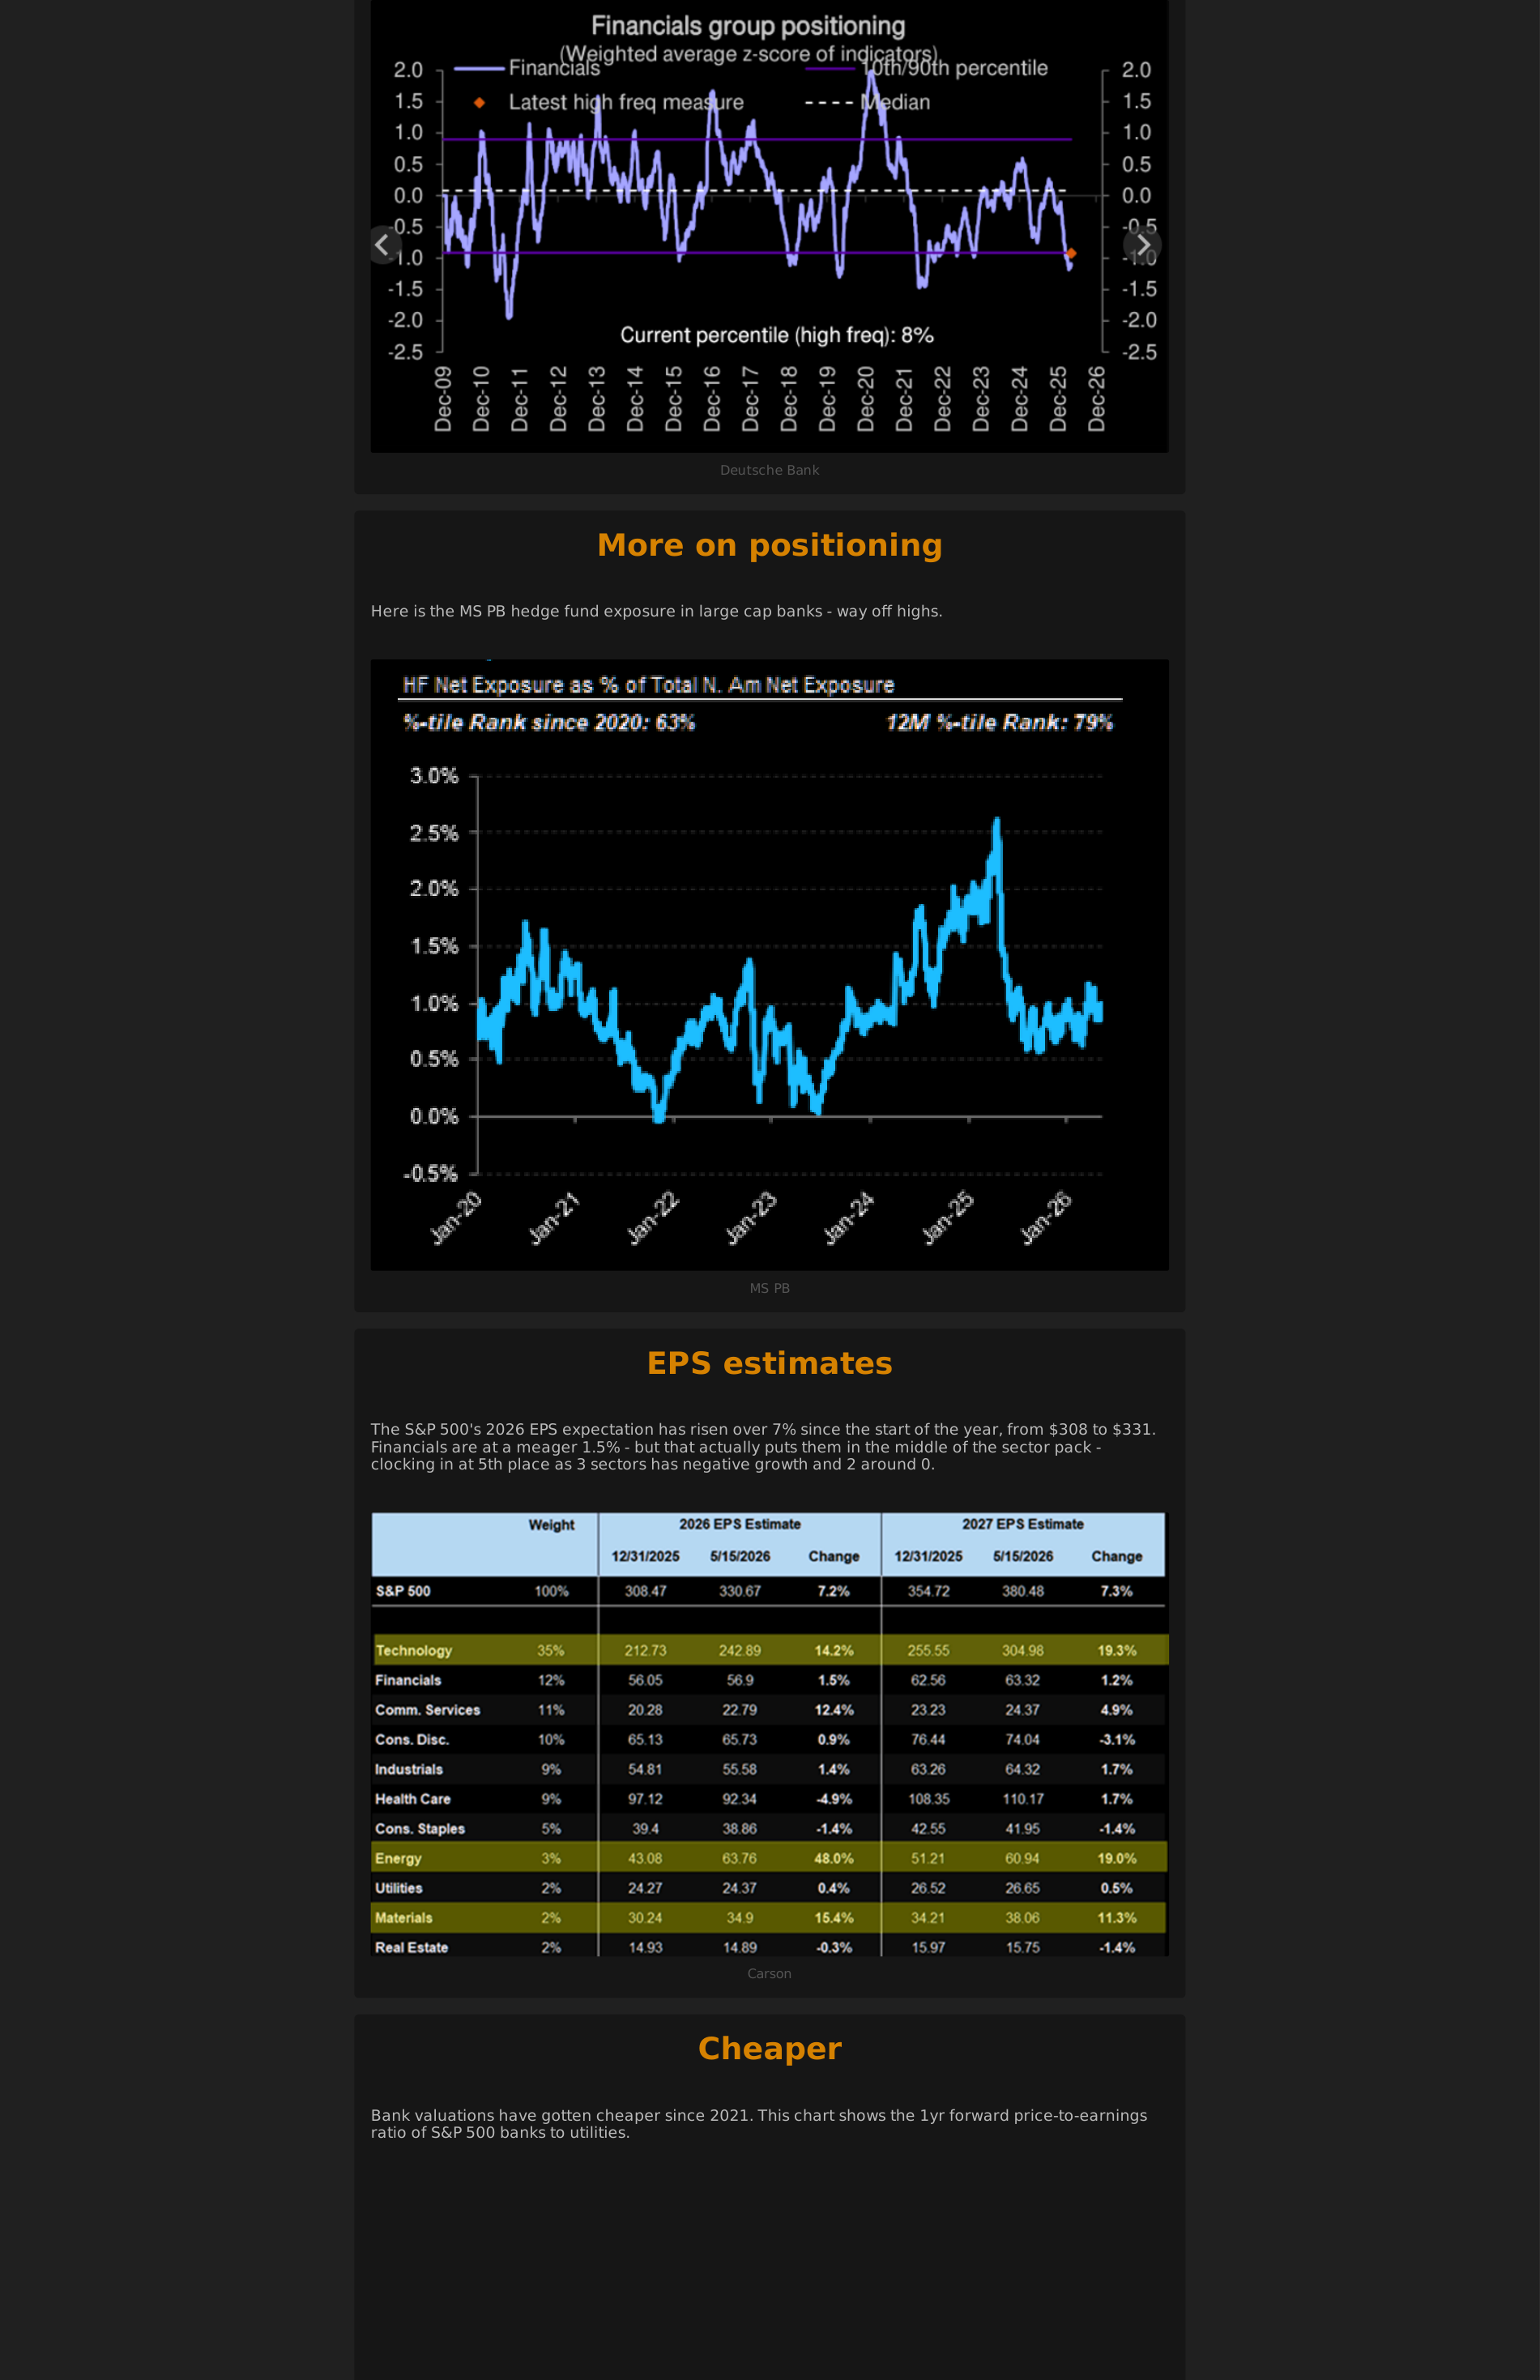
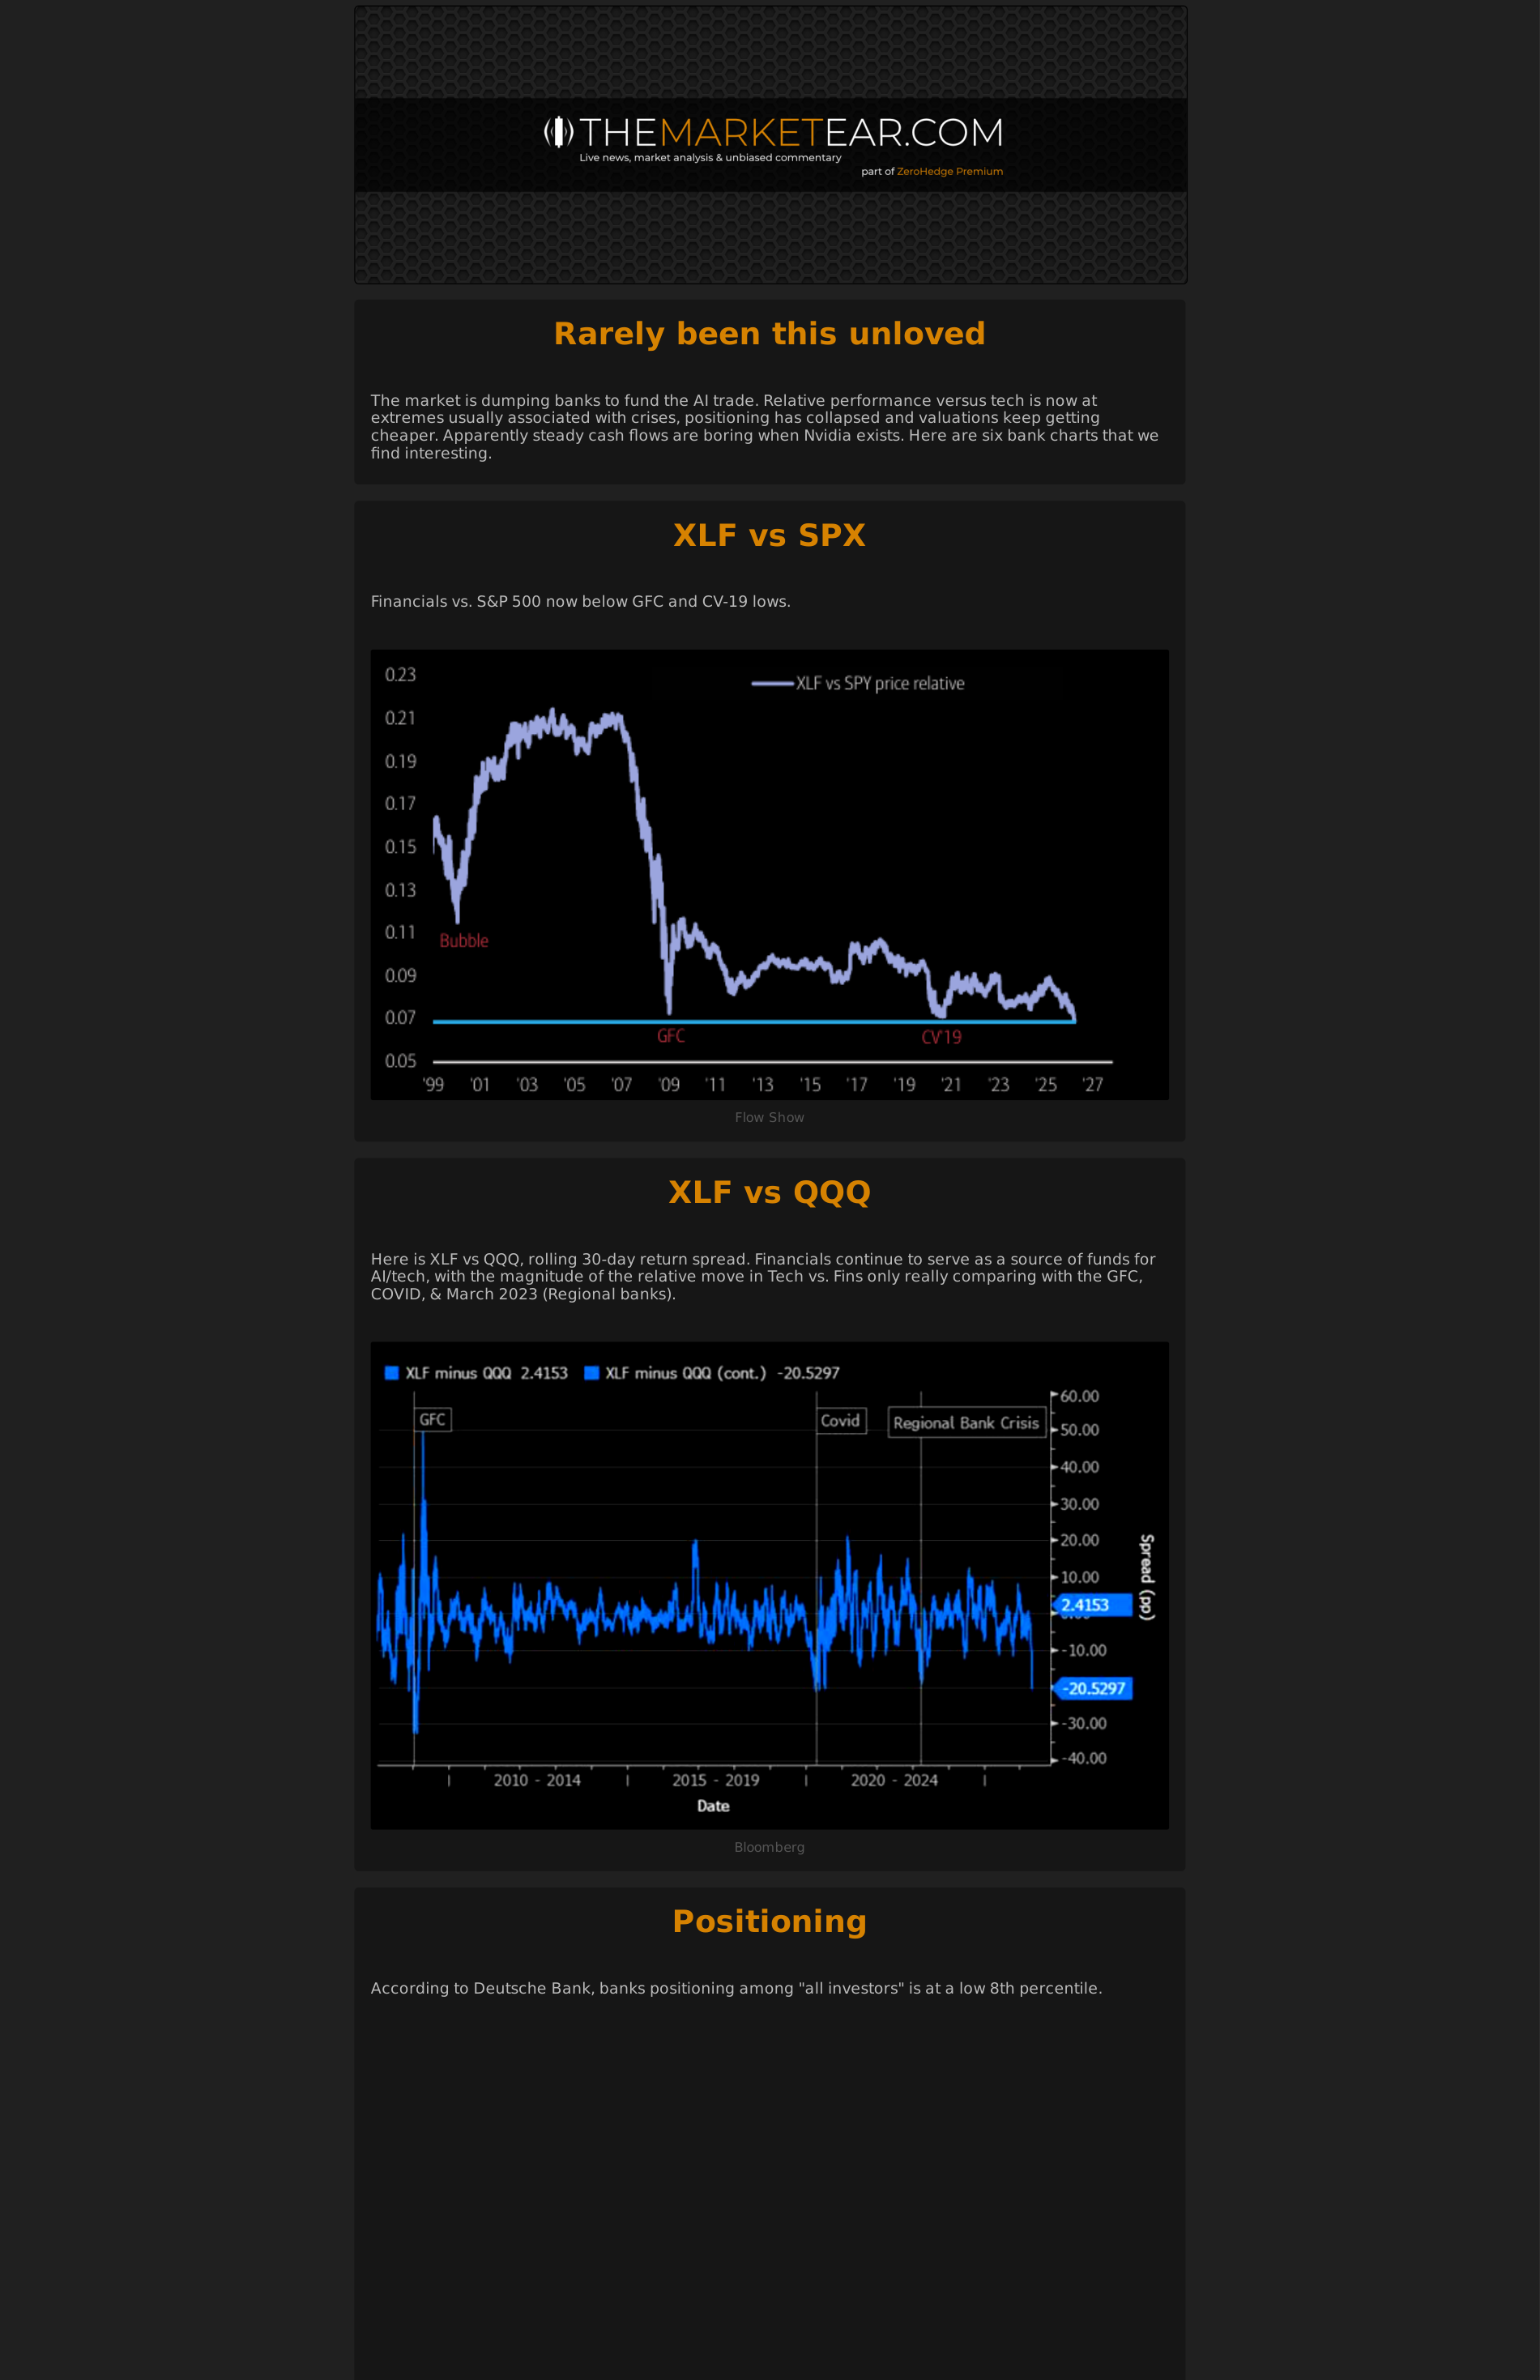
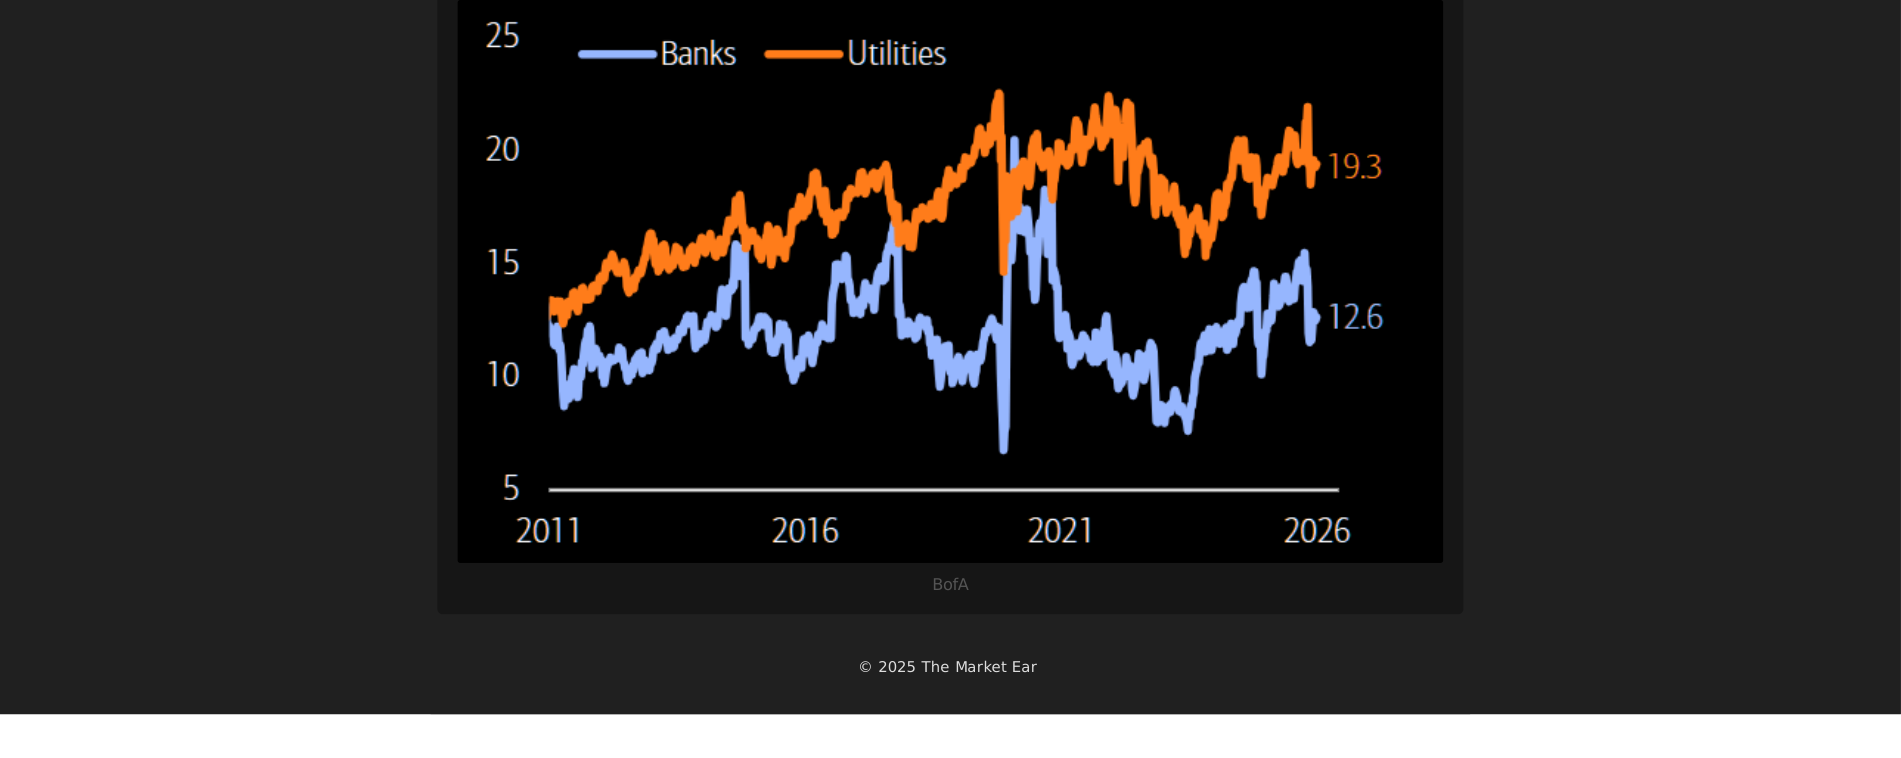
Page 2 | Everyone Hates Banks
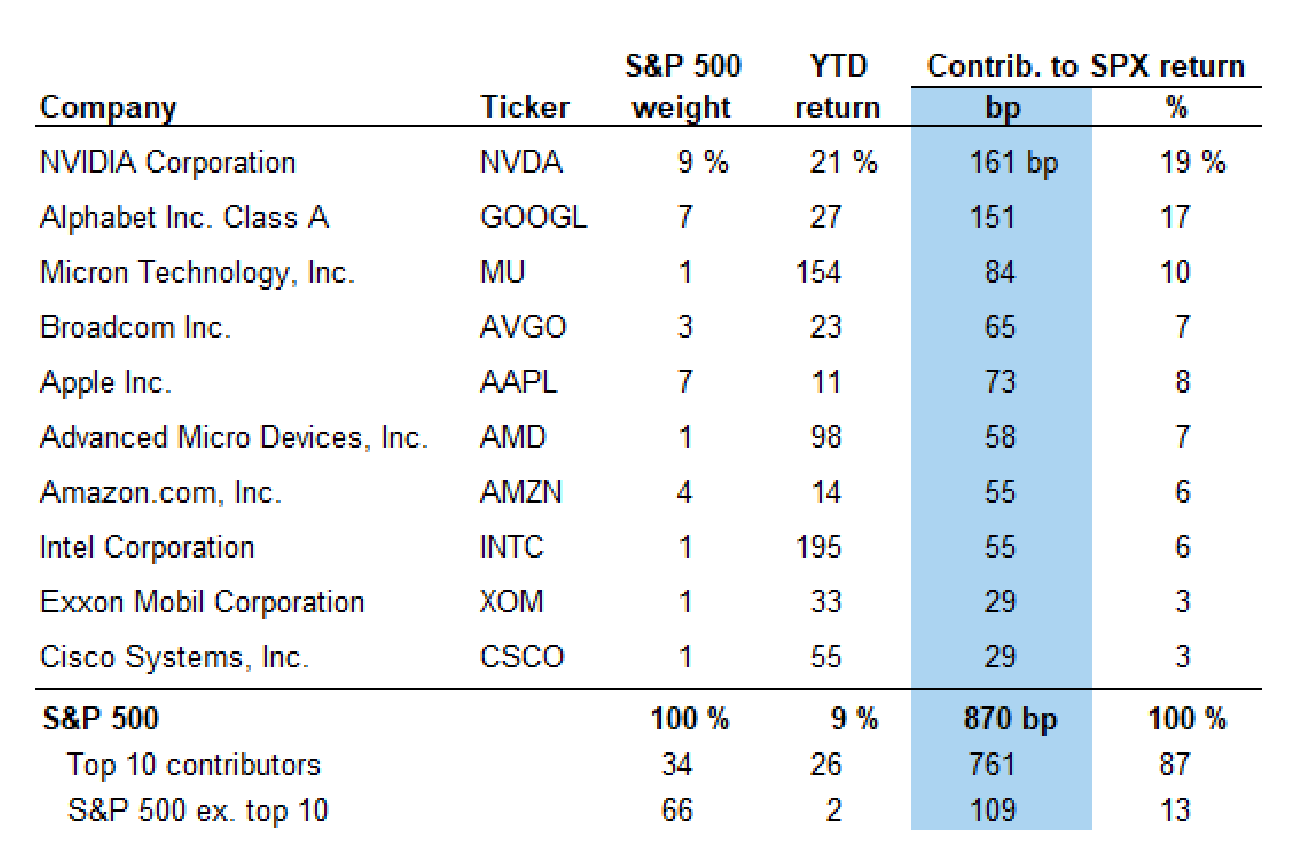
What it says: Everyone Hates Banks: Deutsche Bank More on positioning Here is the MS PB hedge fund exposure in large cap banks - way off highs. MS PB EPS estimates The S&P 500's 2026 EPS expectation has risen over 7% since the start of the year, from $308 to $331. Financials are at a meager 1...
Worldview update: The bearish macro case needs earnings to crack. Until that happens, selloffs can remain buyable even if the rally quality deteriorates.
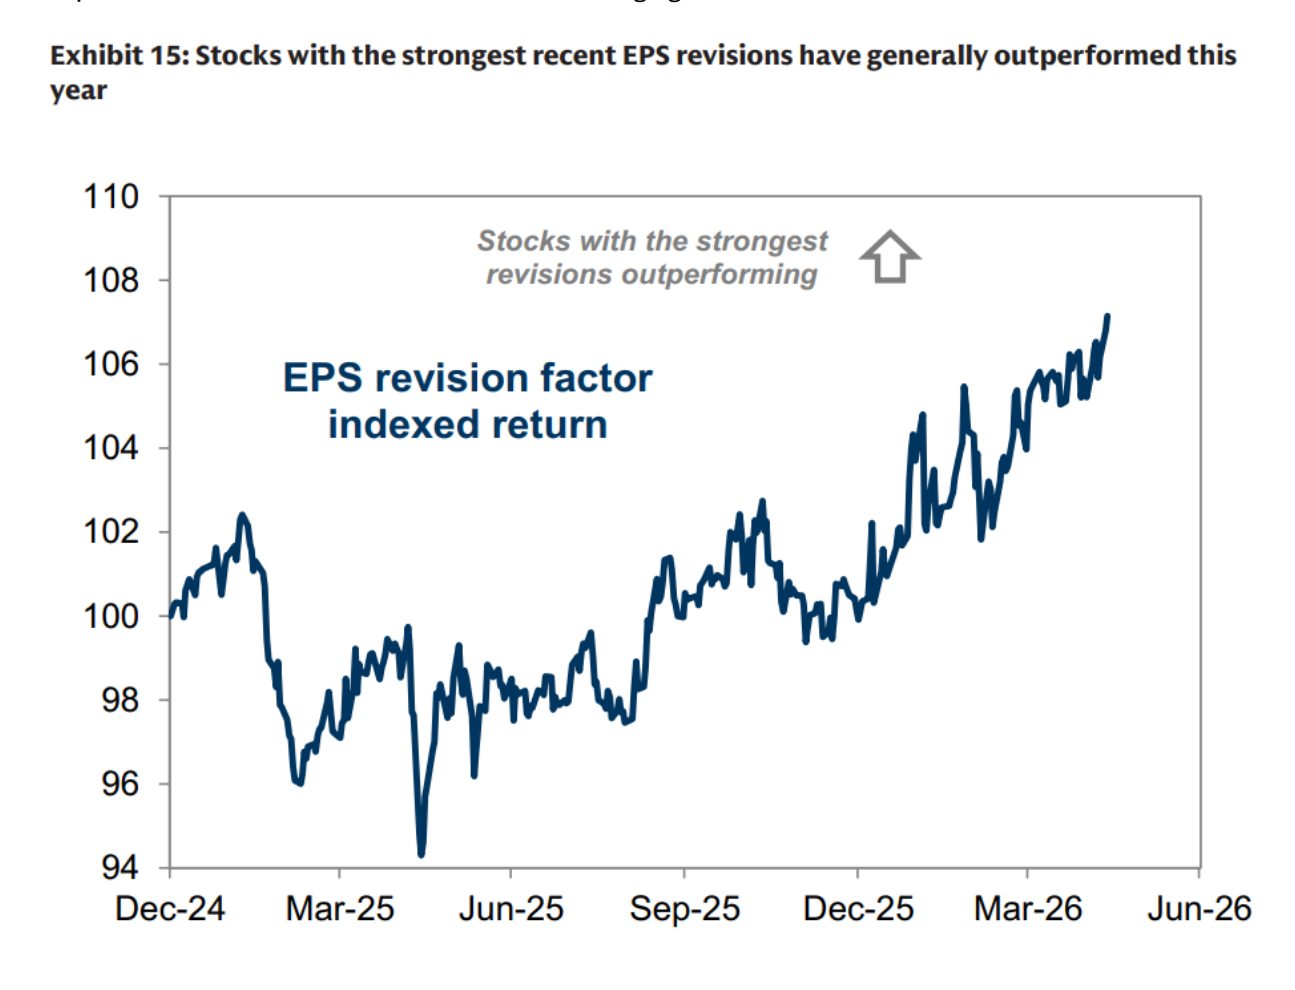
Portfolio/use: Track breadth of EPS revisions, not just index EPS. Narrow earnings strength is less durable.
2. Oil stress is feeding rates, while equities are looking through it
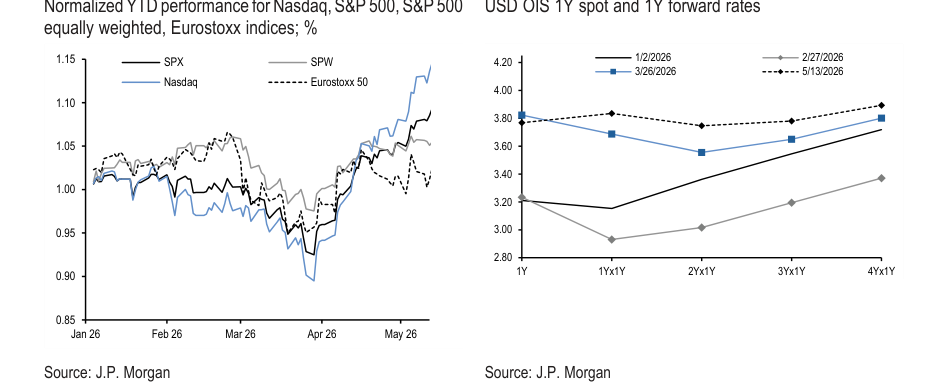
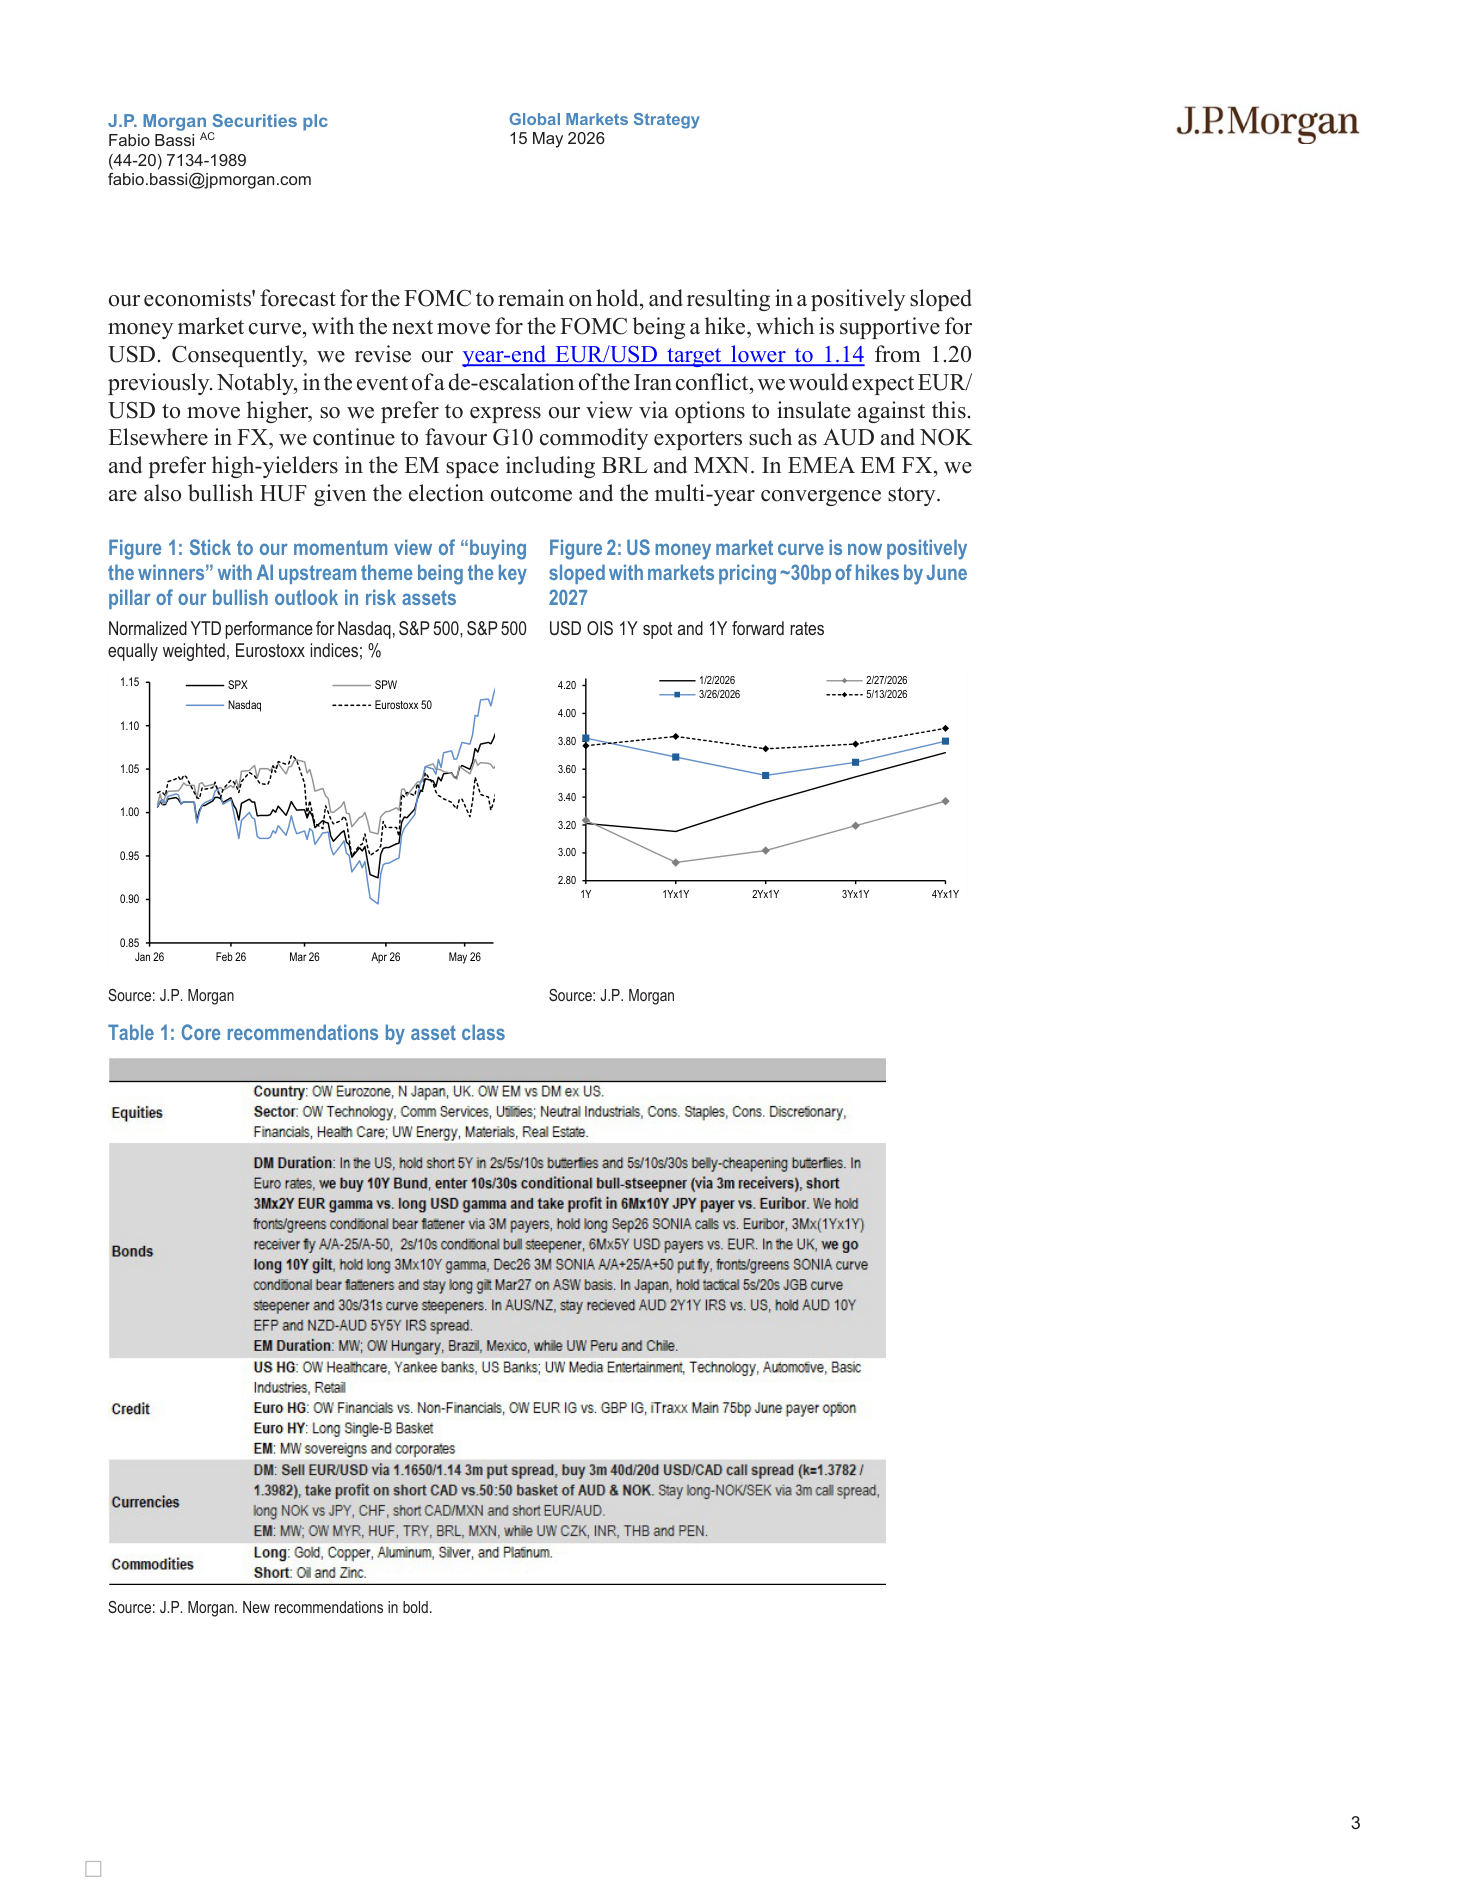
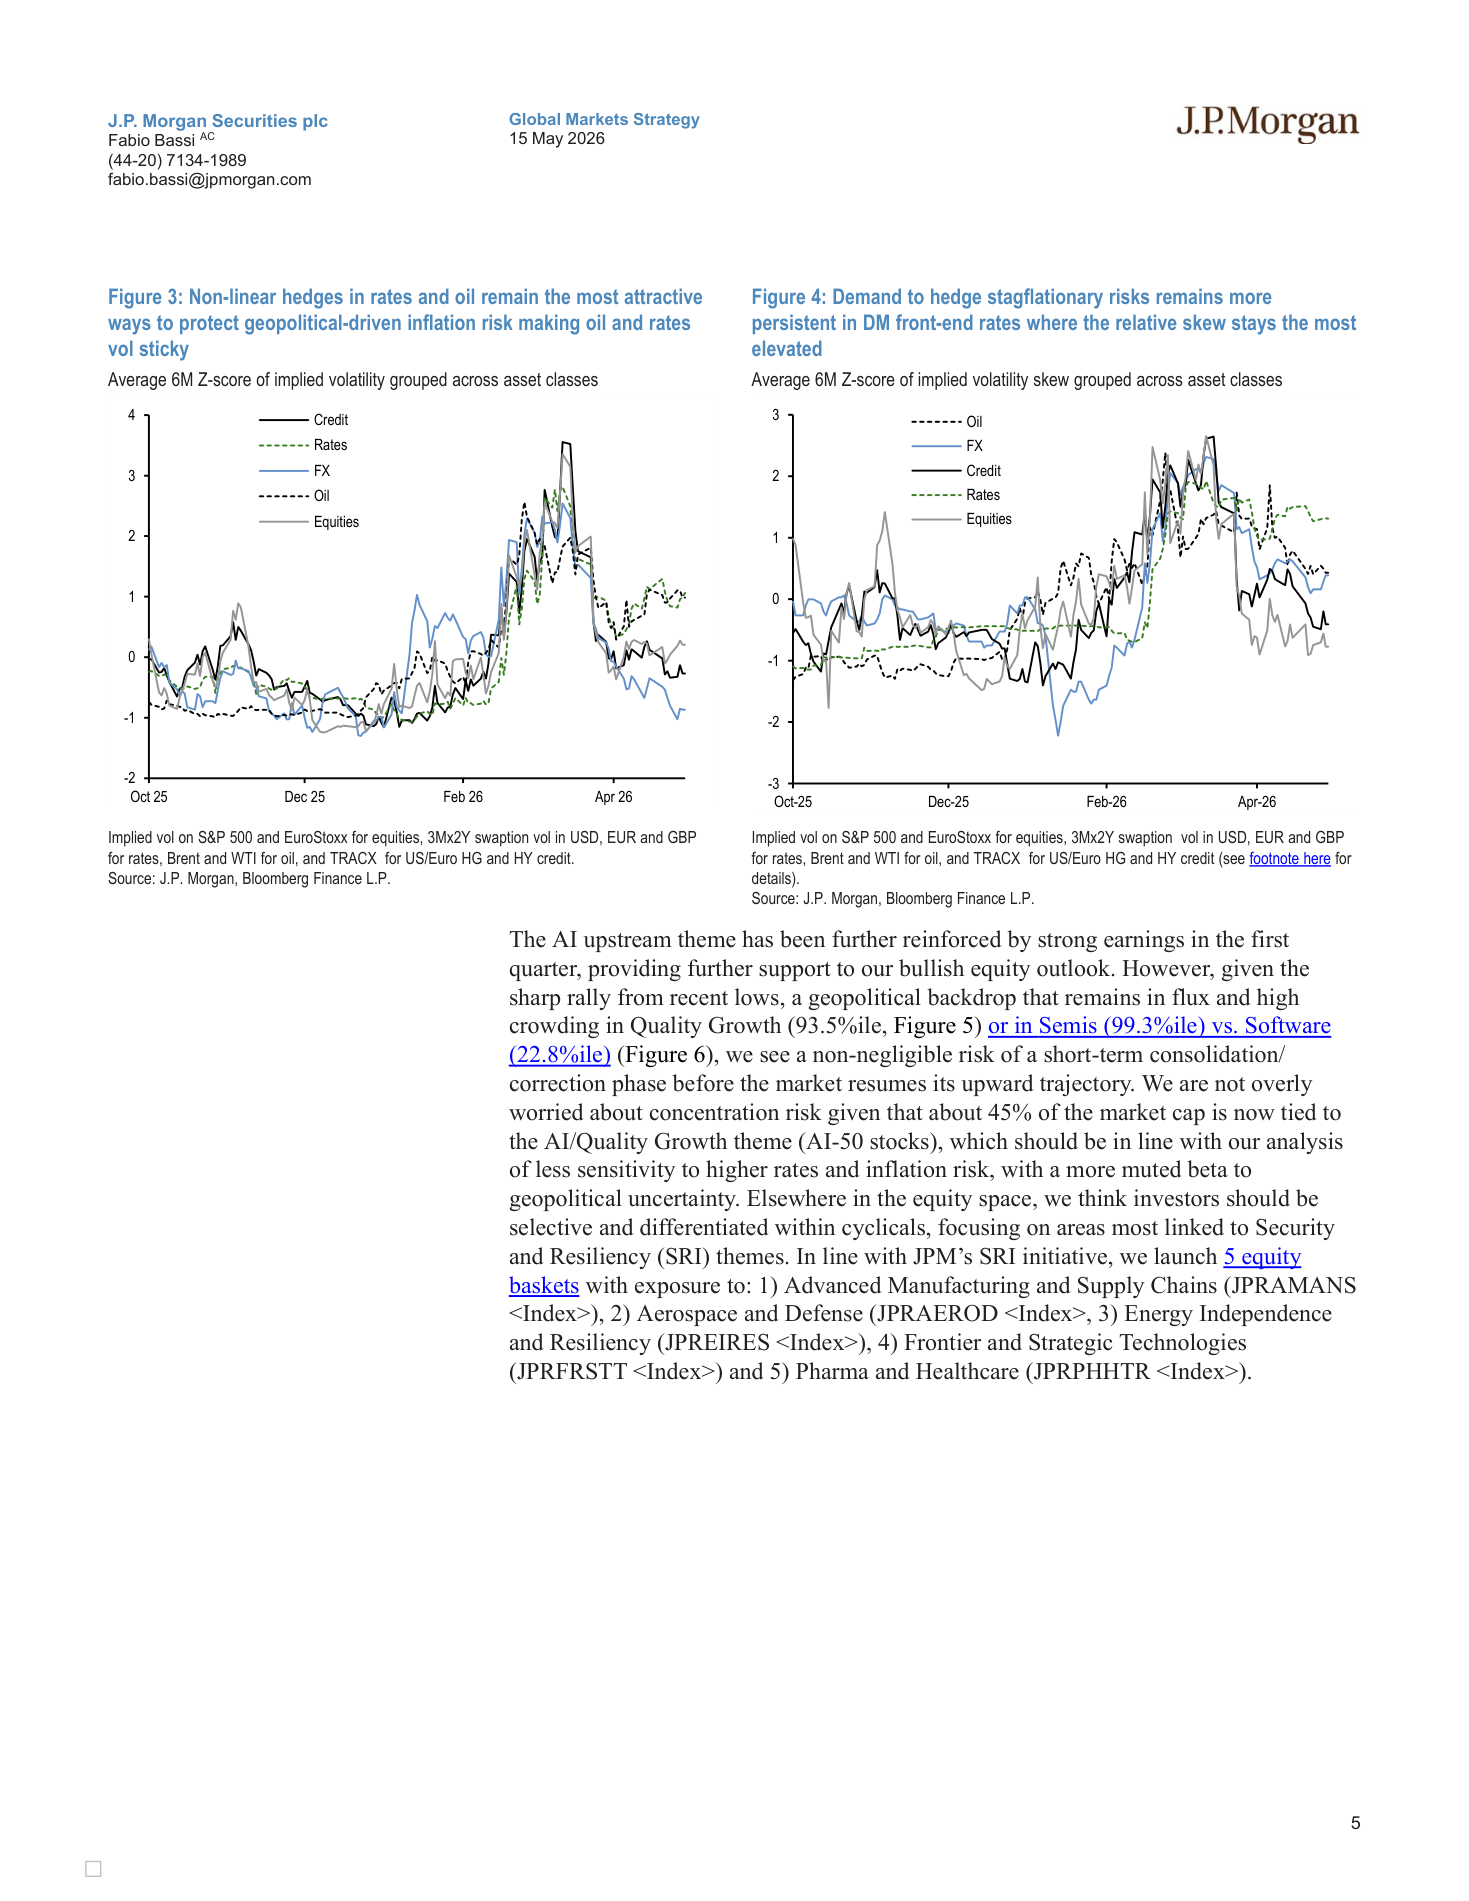
Page 3 | JPM The J P Morgan View Higher for Longer in Oil and Rates Own AI
What it says: JPM The J P Morgan View Higher for Longer in Oil and Rates Own AI: Figure 1: Stick to our momentum view of “buying the winners” with AI upstream theme being the key pillar of our bullish outlook in risk assets Normalized YTD performance for Nasdaq, S&P 500, S&P 500 equally weighted, Eurostoxx indices; % 0.85 0.90 0.95 1.00...
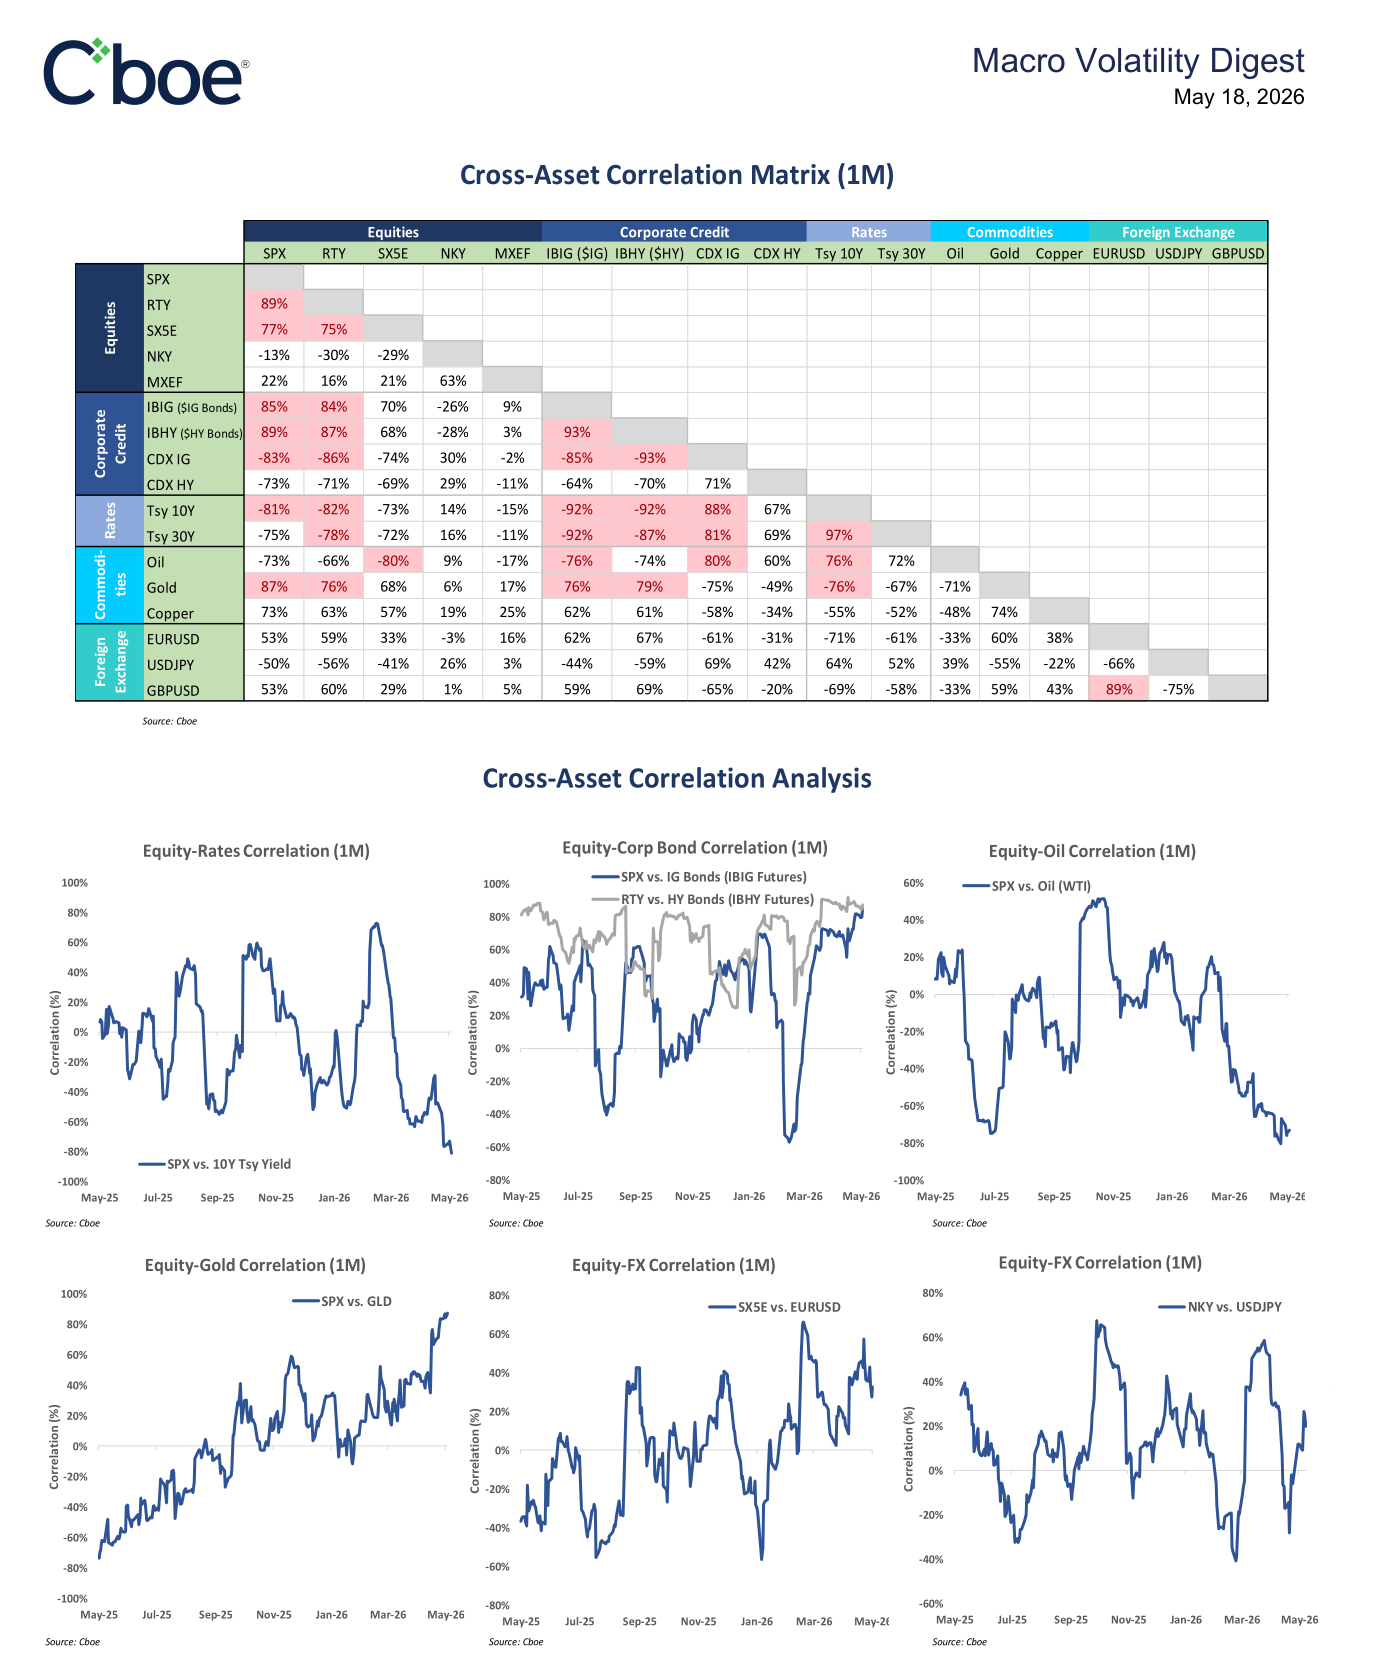
Worldview update: The cleaner market signal is the cross-asset divergence: oil stress has mattered for rates, but equities are already looking through it. That calm is fragile if energy pressure starts feeding inflation or growth expectations again.
Portfolio/use: Track Brent, rates, and equity correlation together; use oil/rates stress as the warning light rather than treating headlines in isolation.
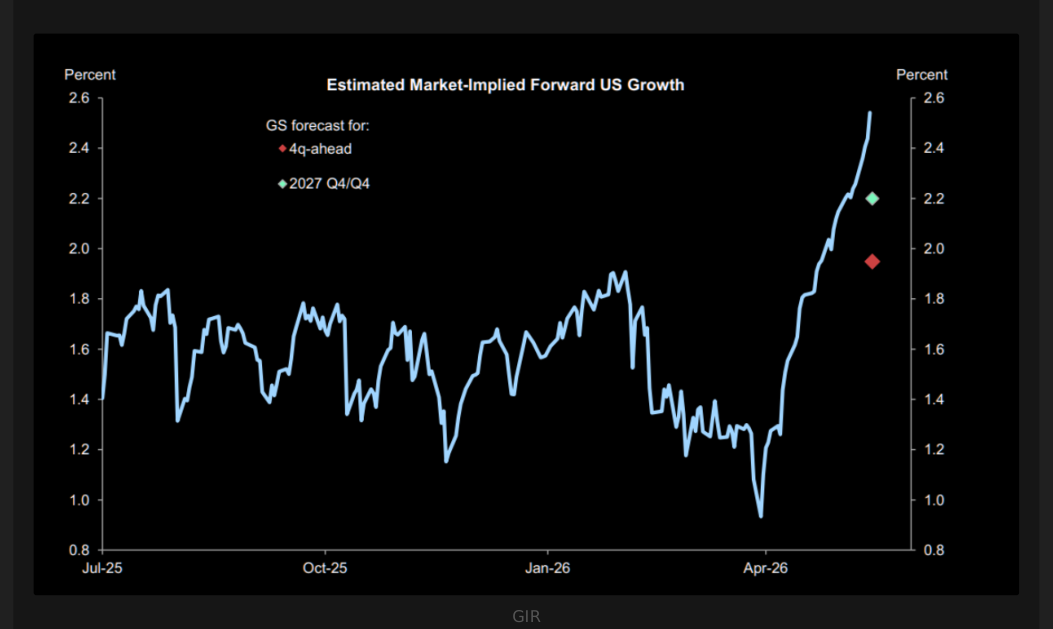
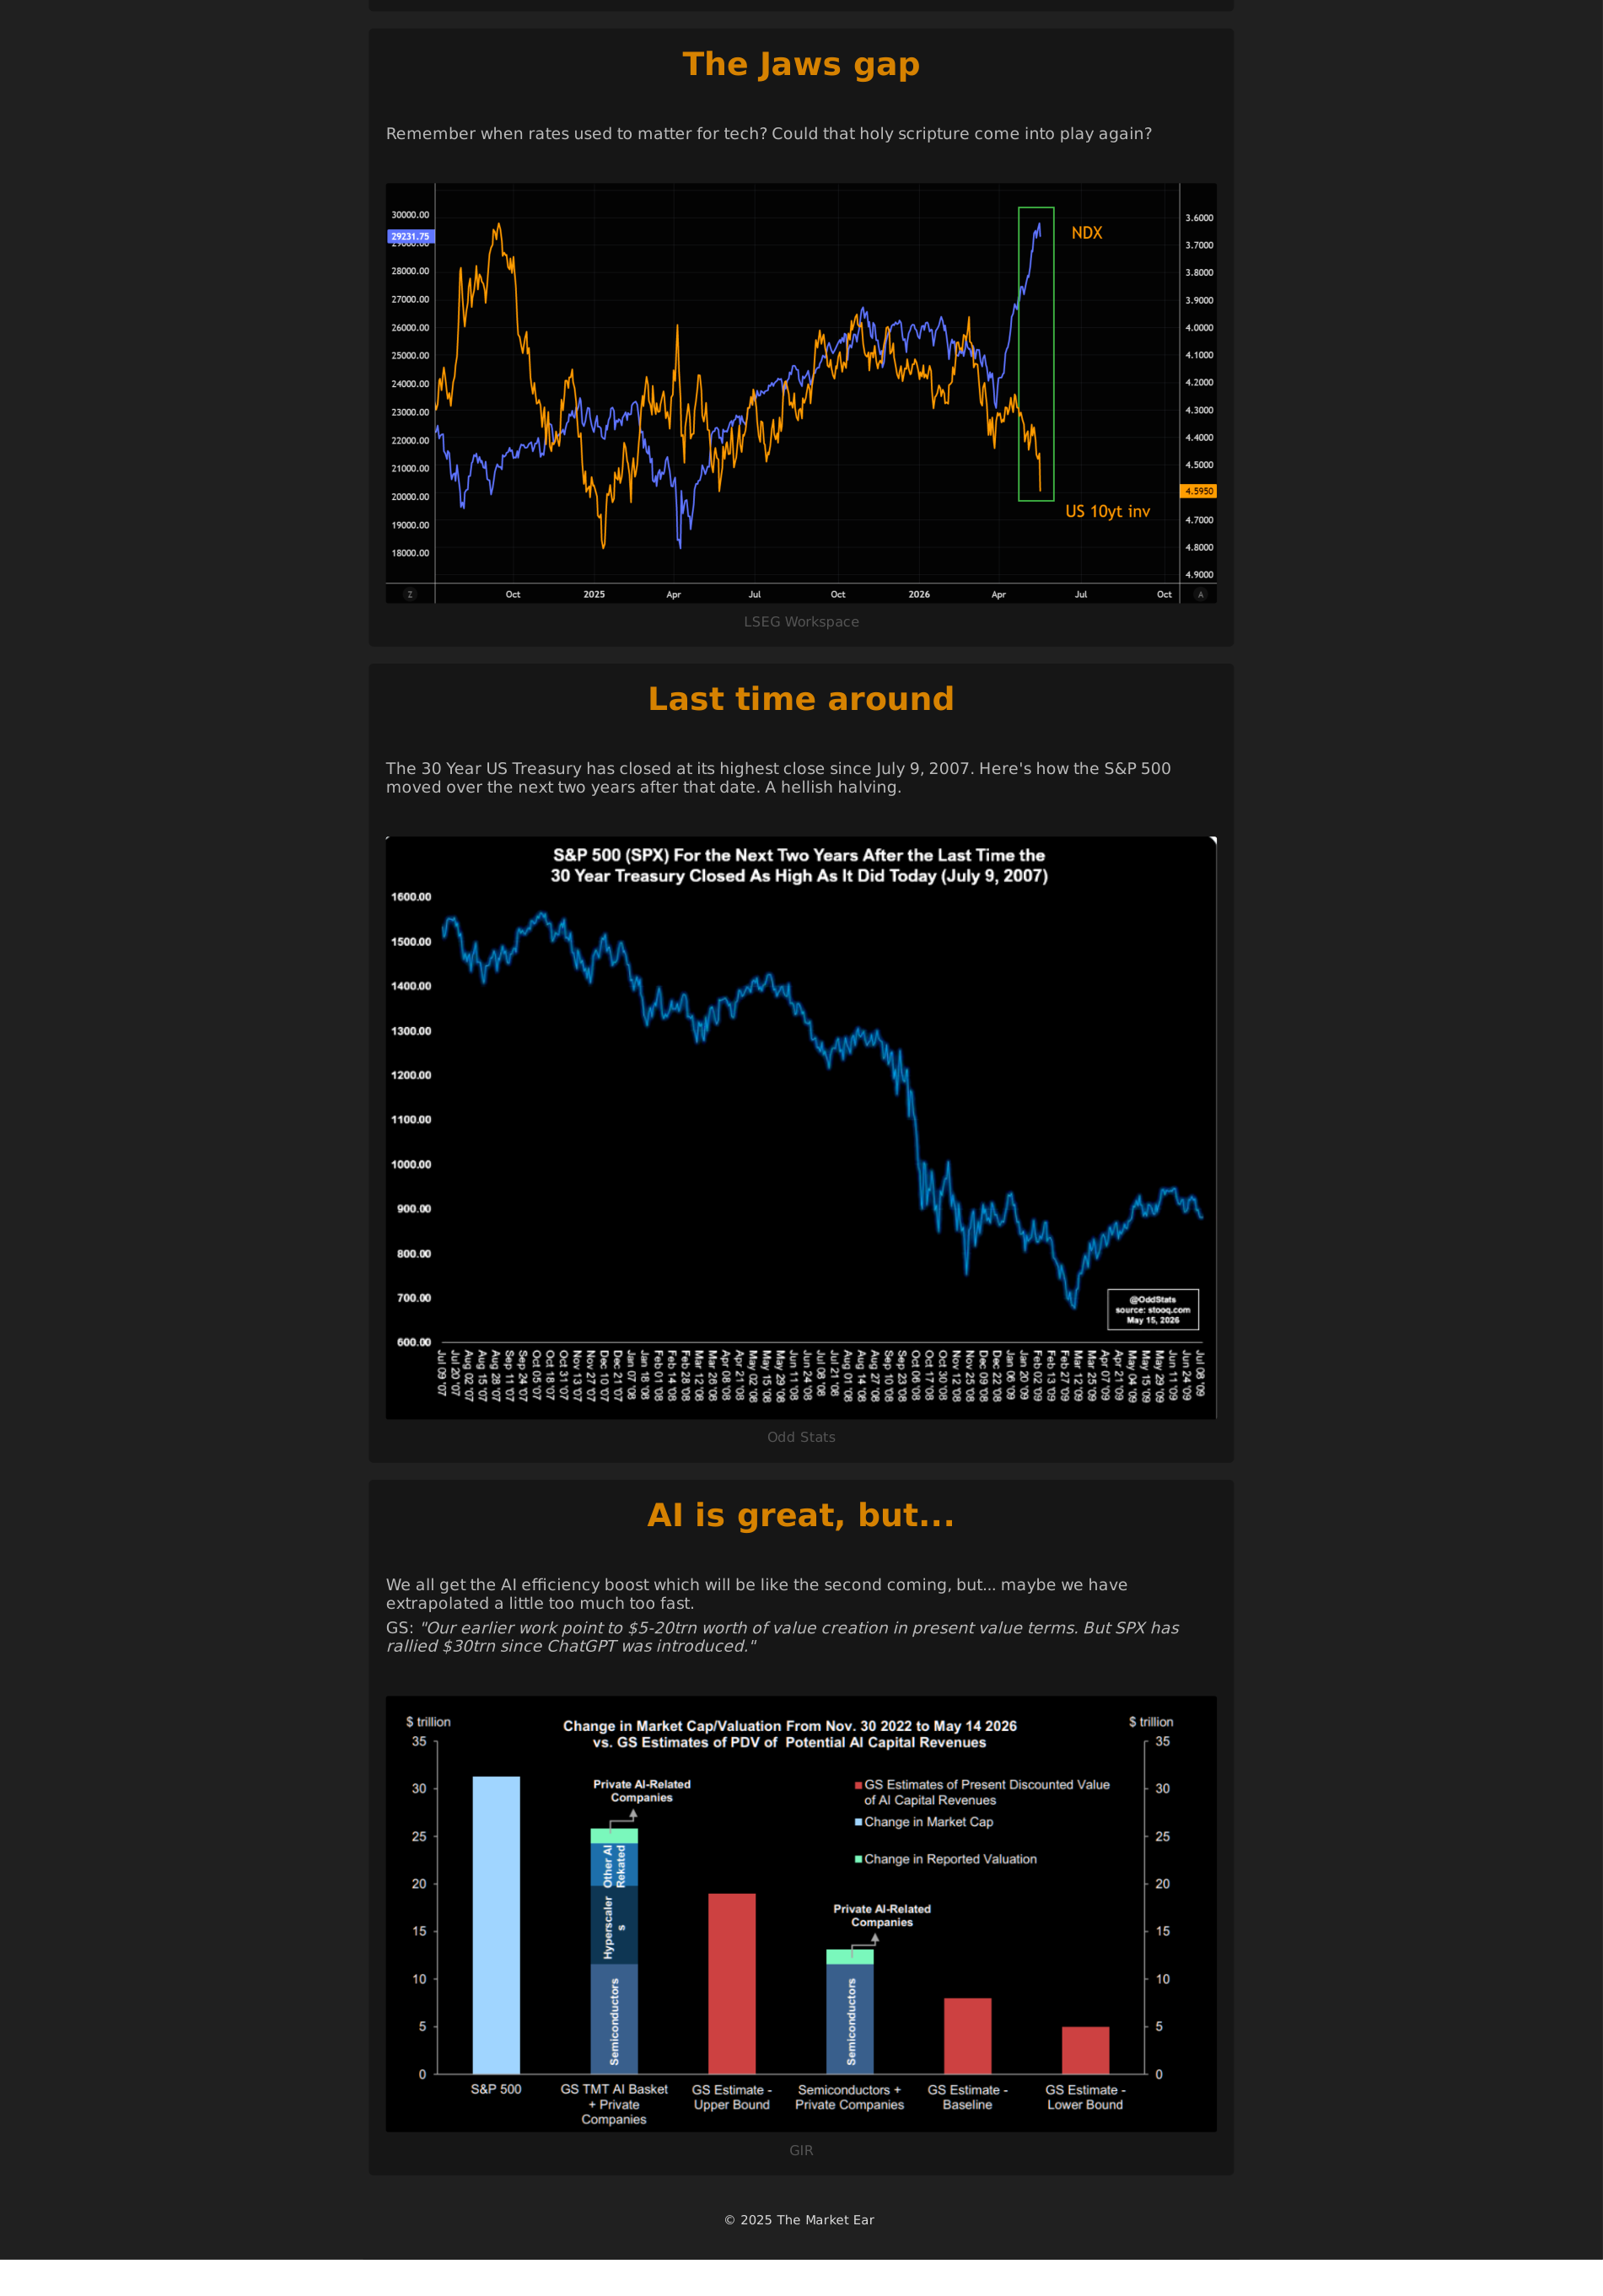
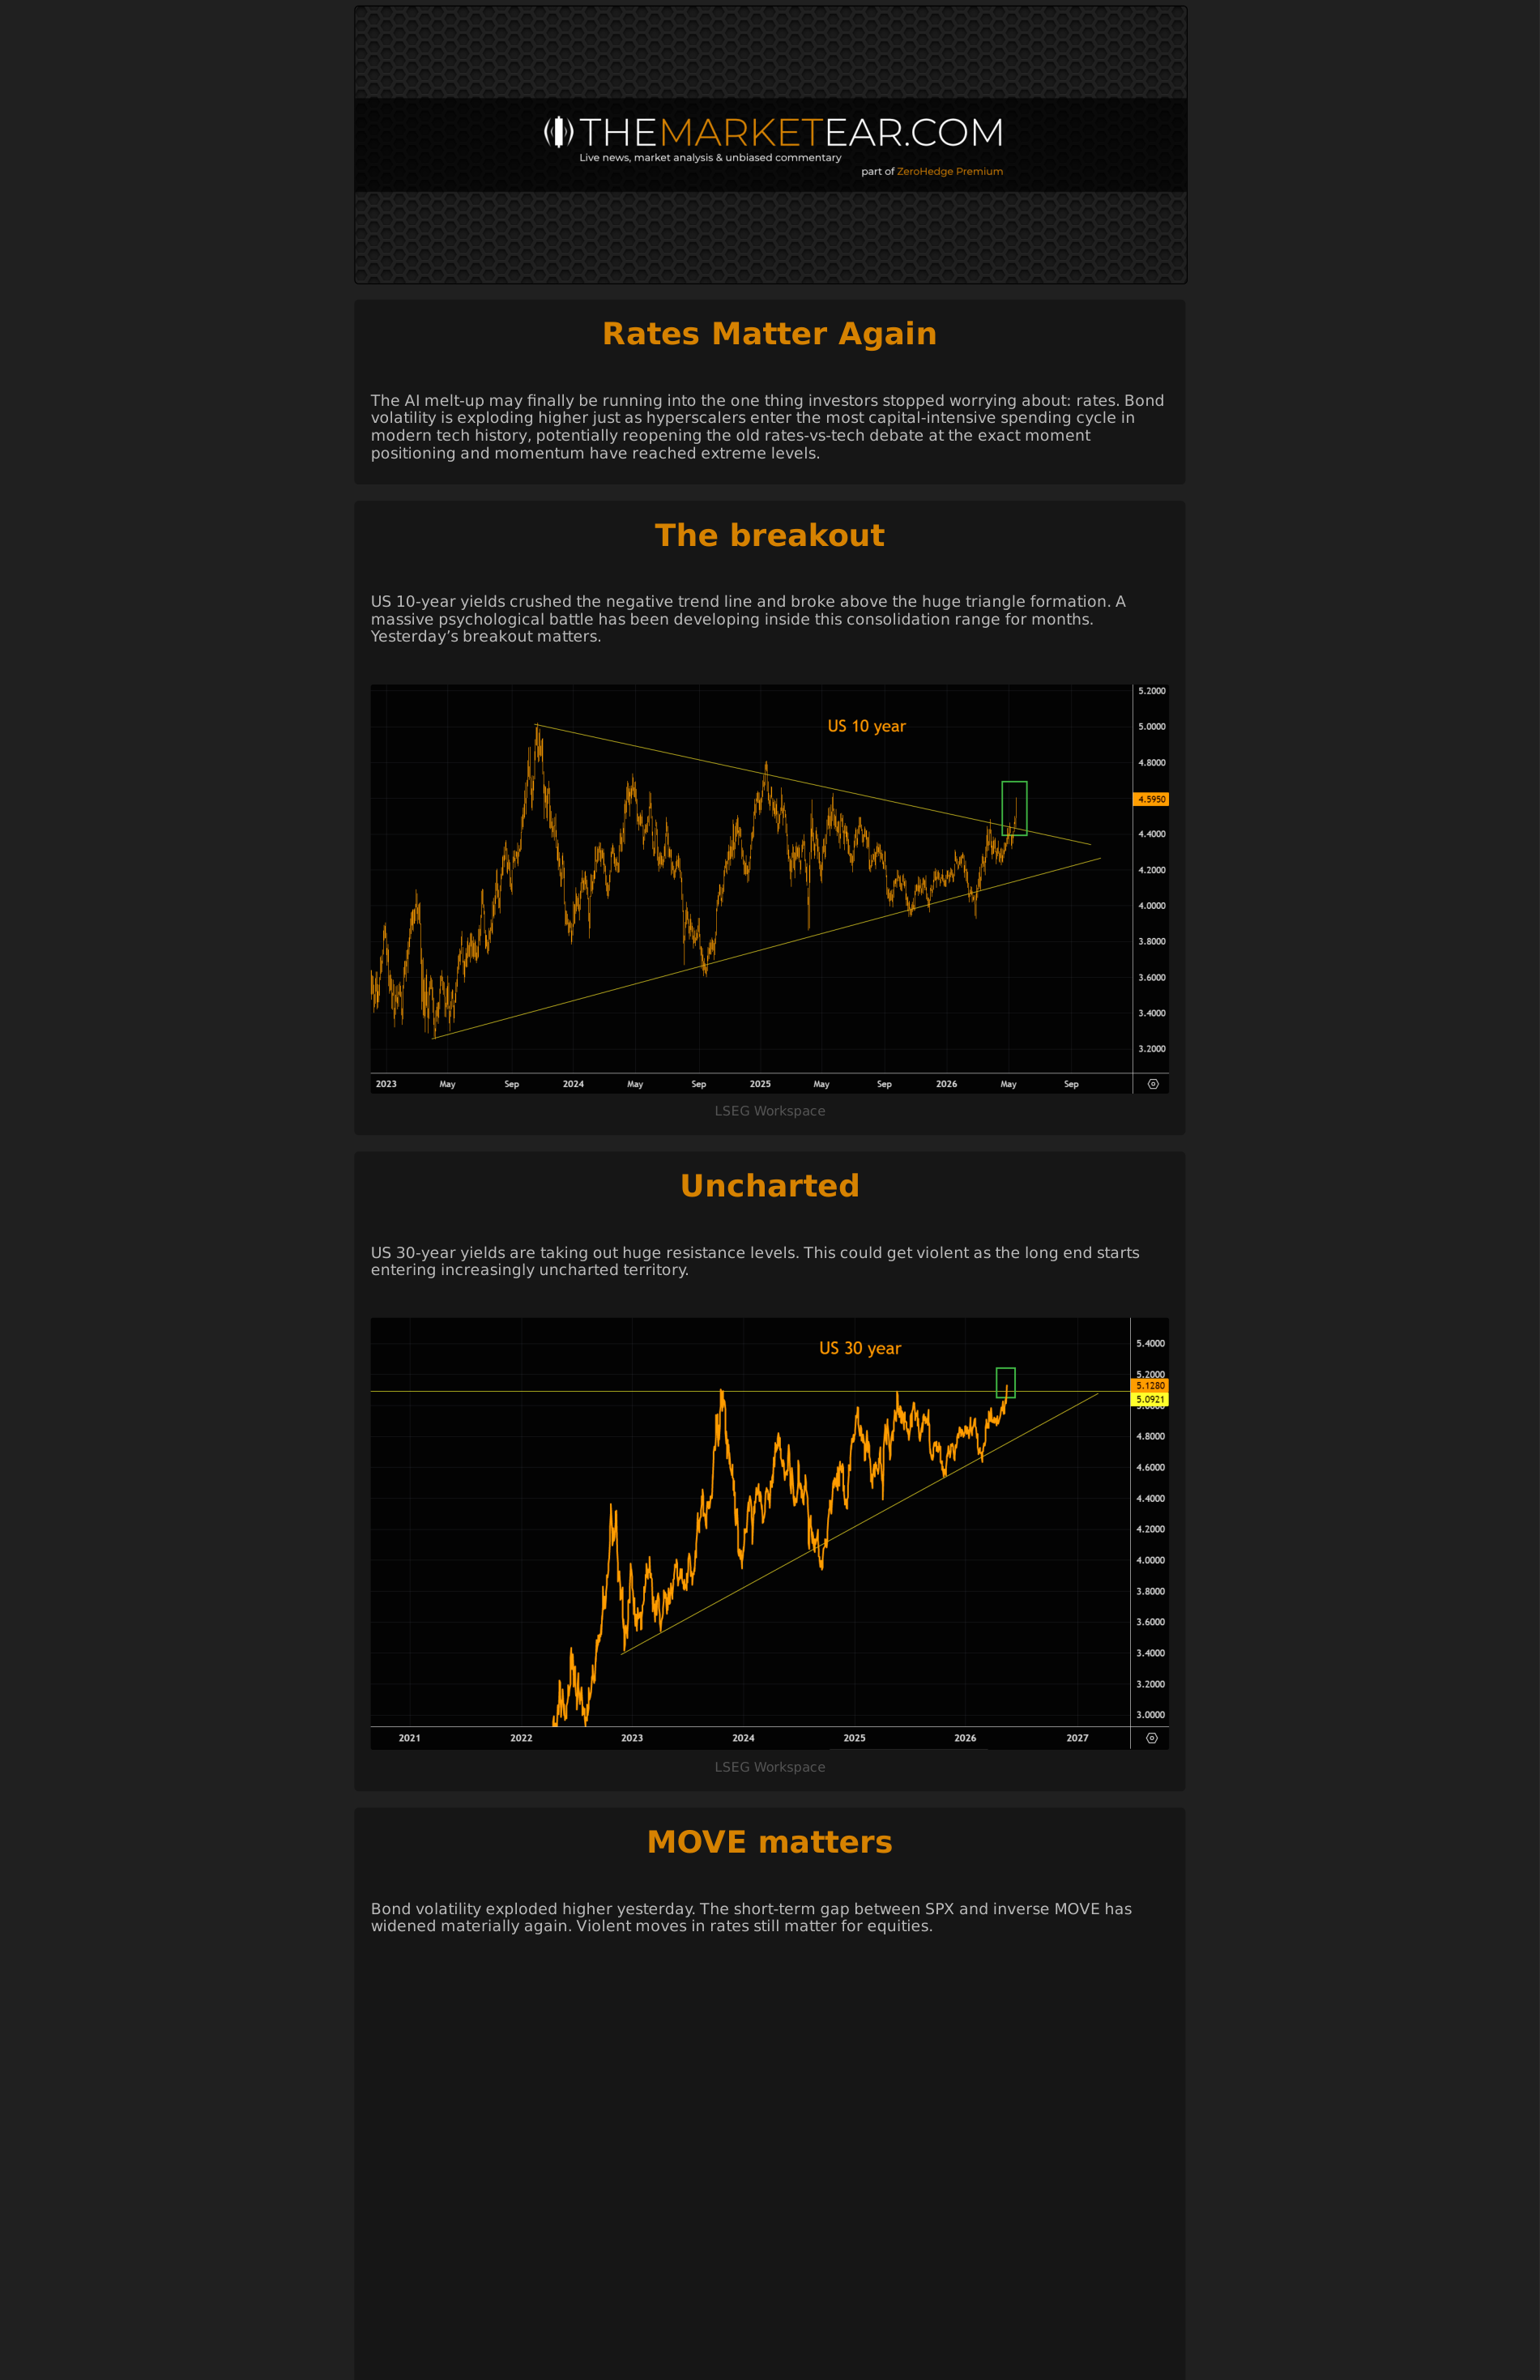
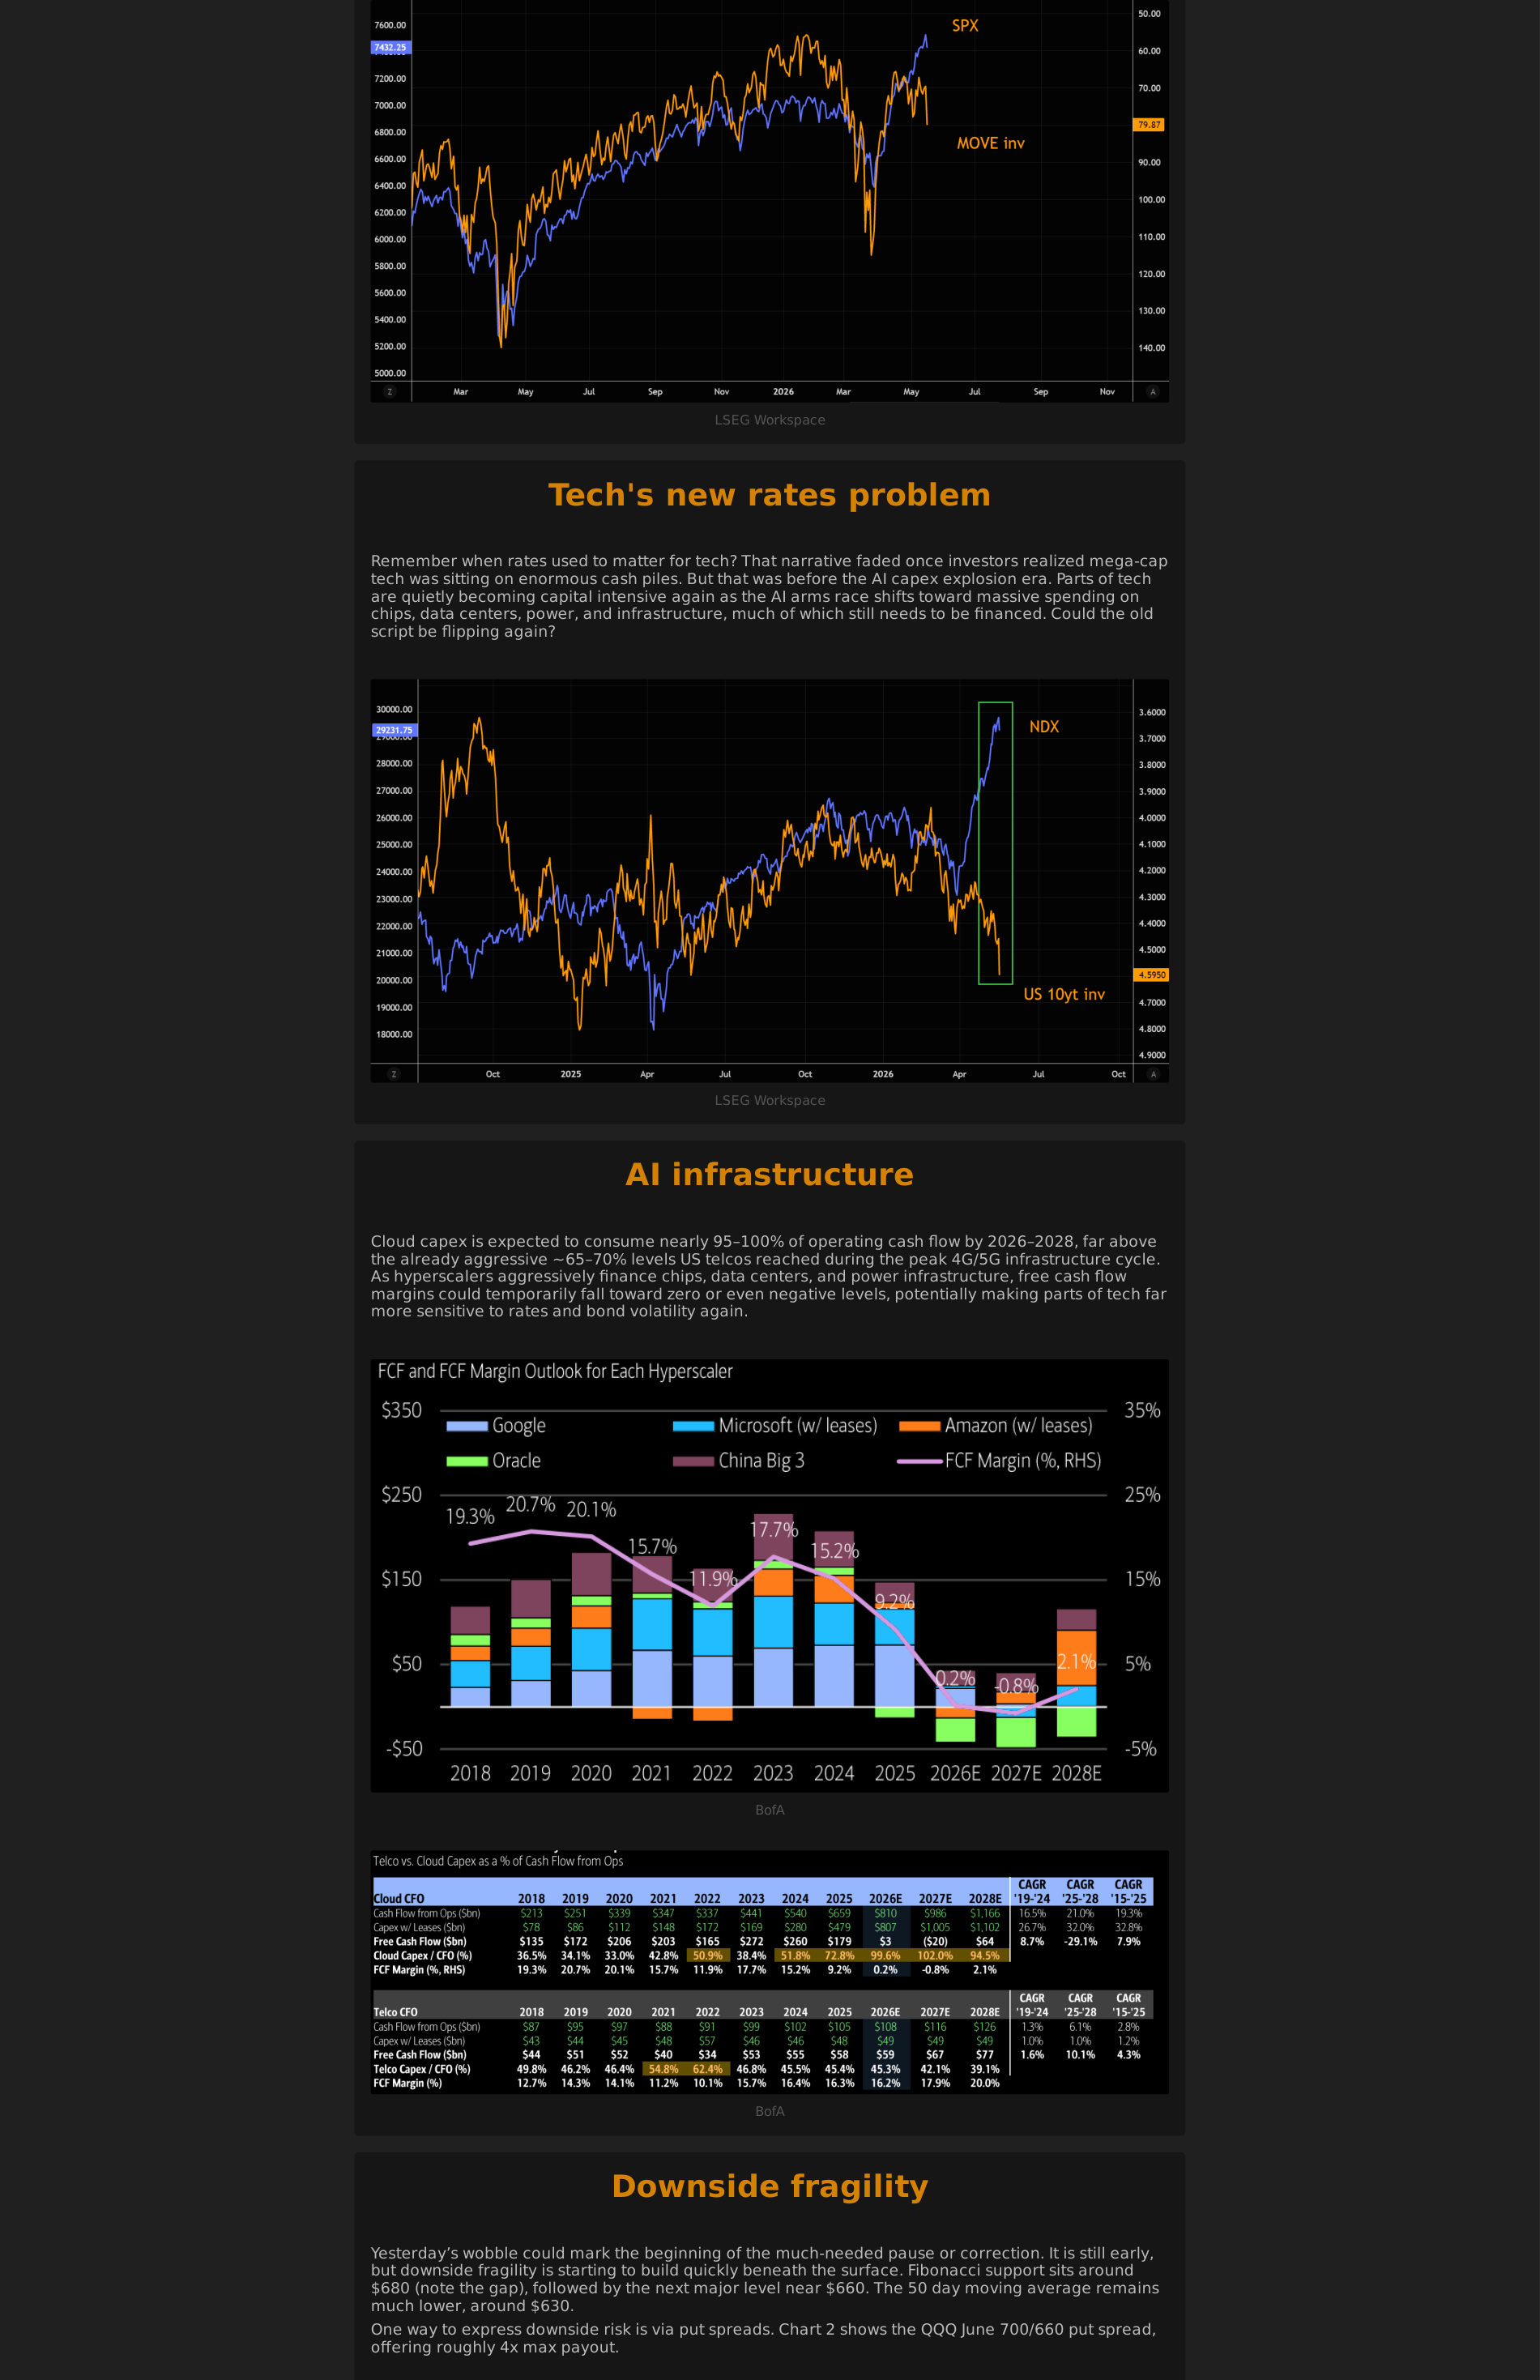
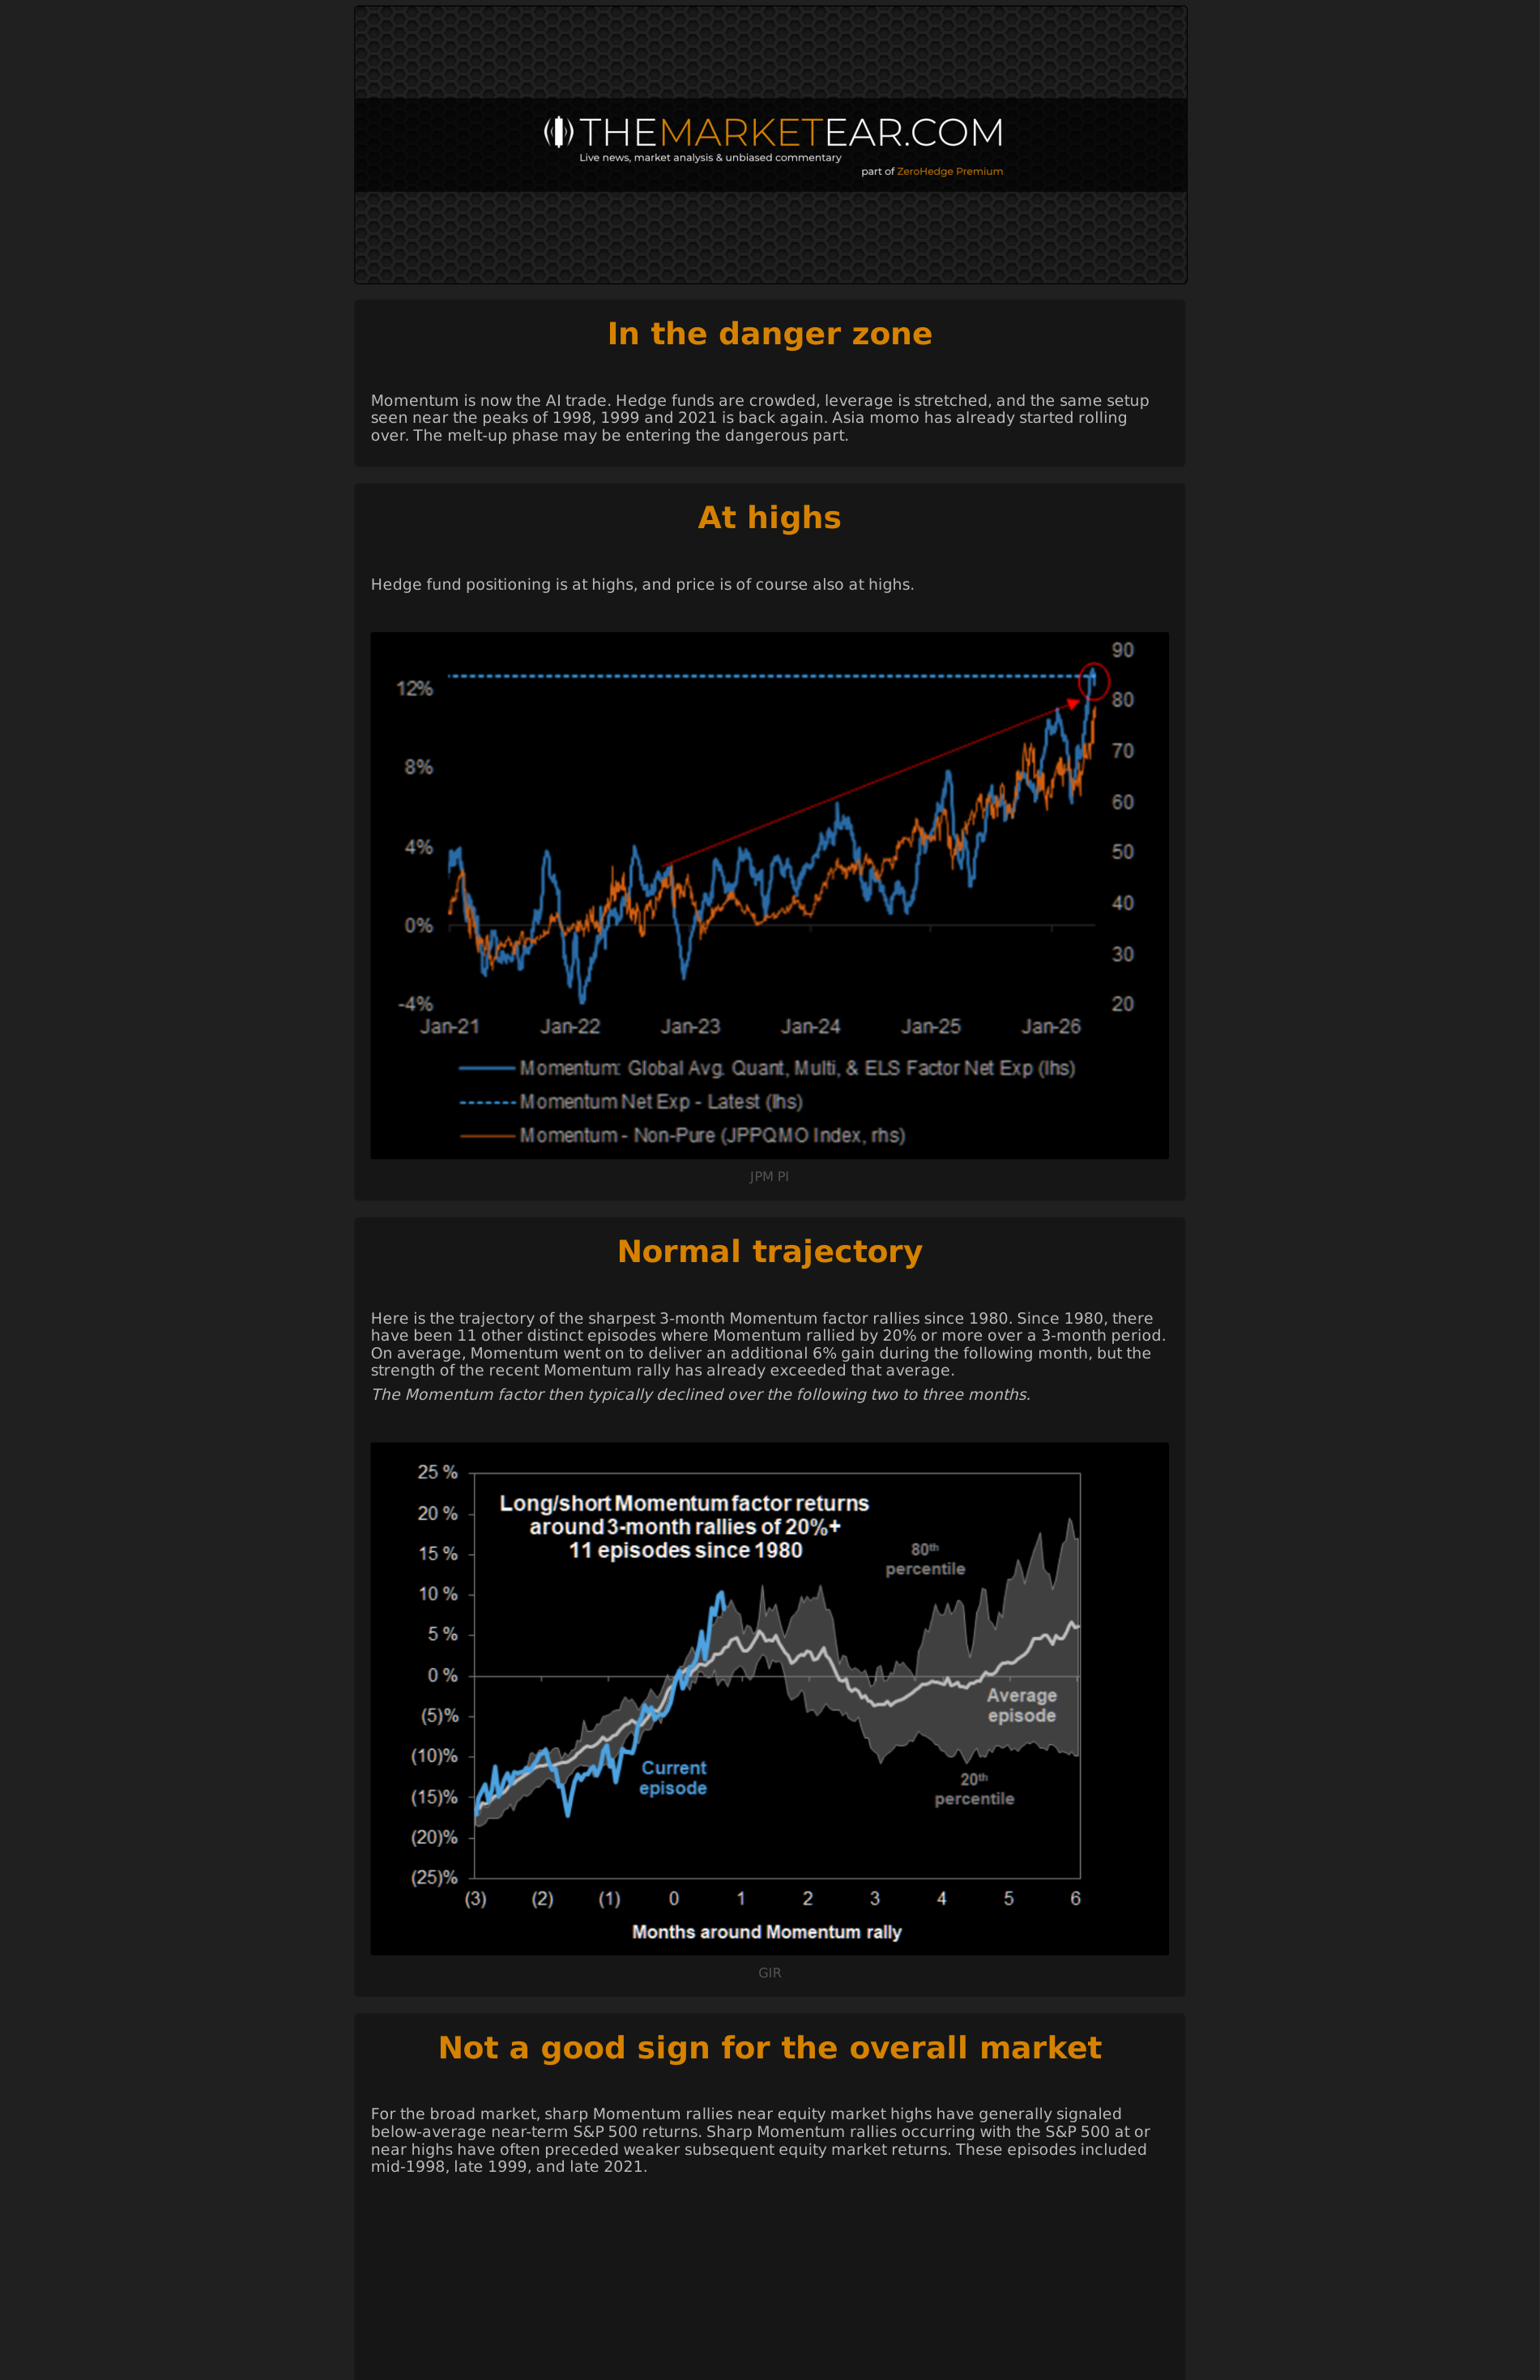
3. AI is becoming a capex, power, and politics story
Page 1 | different this time
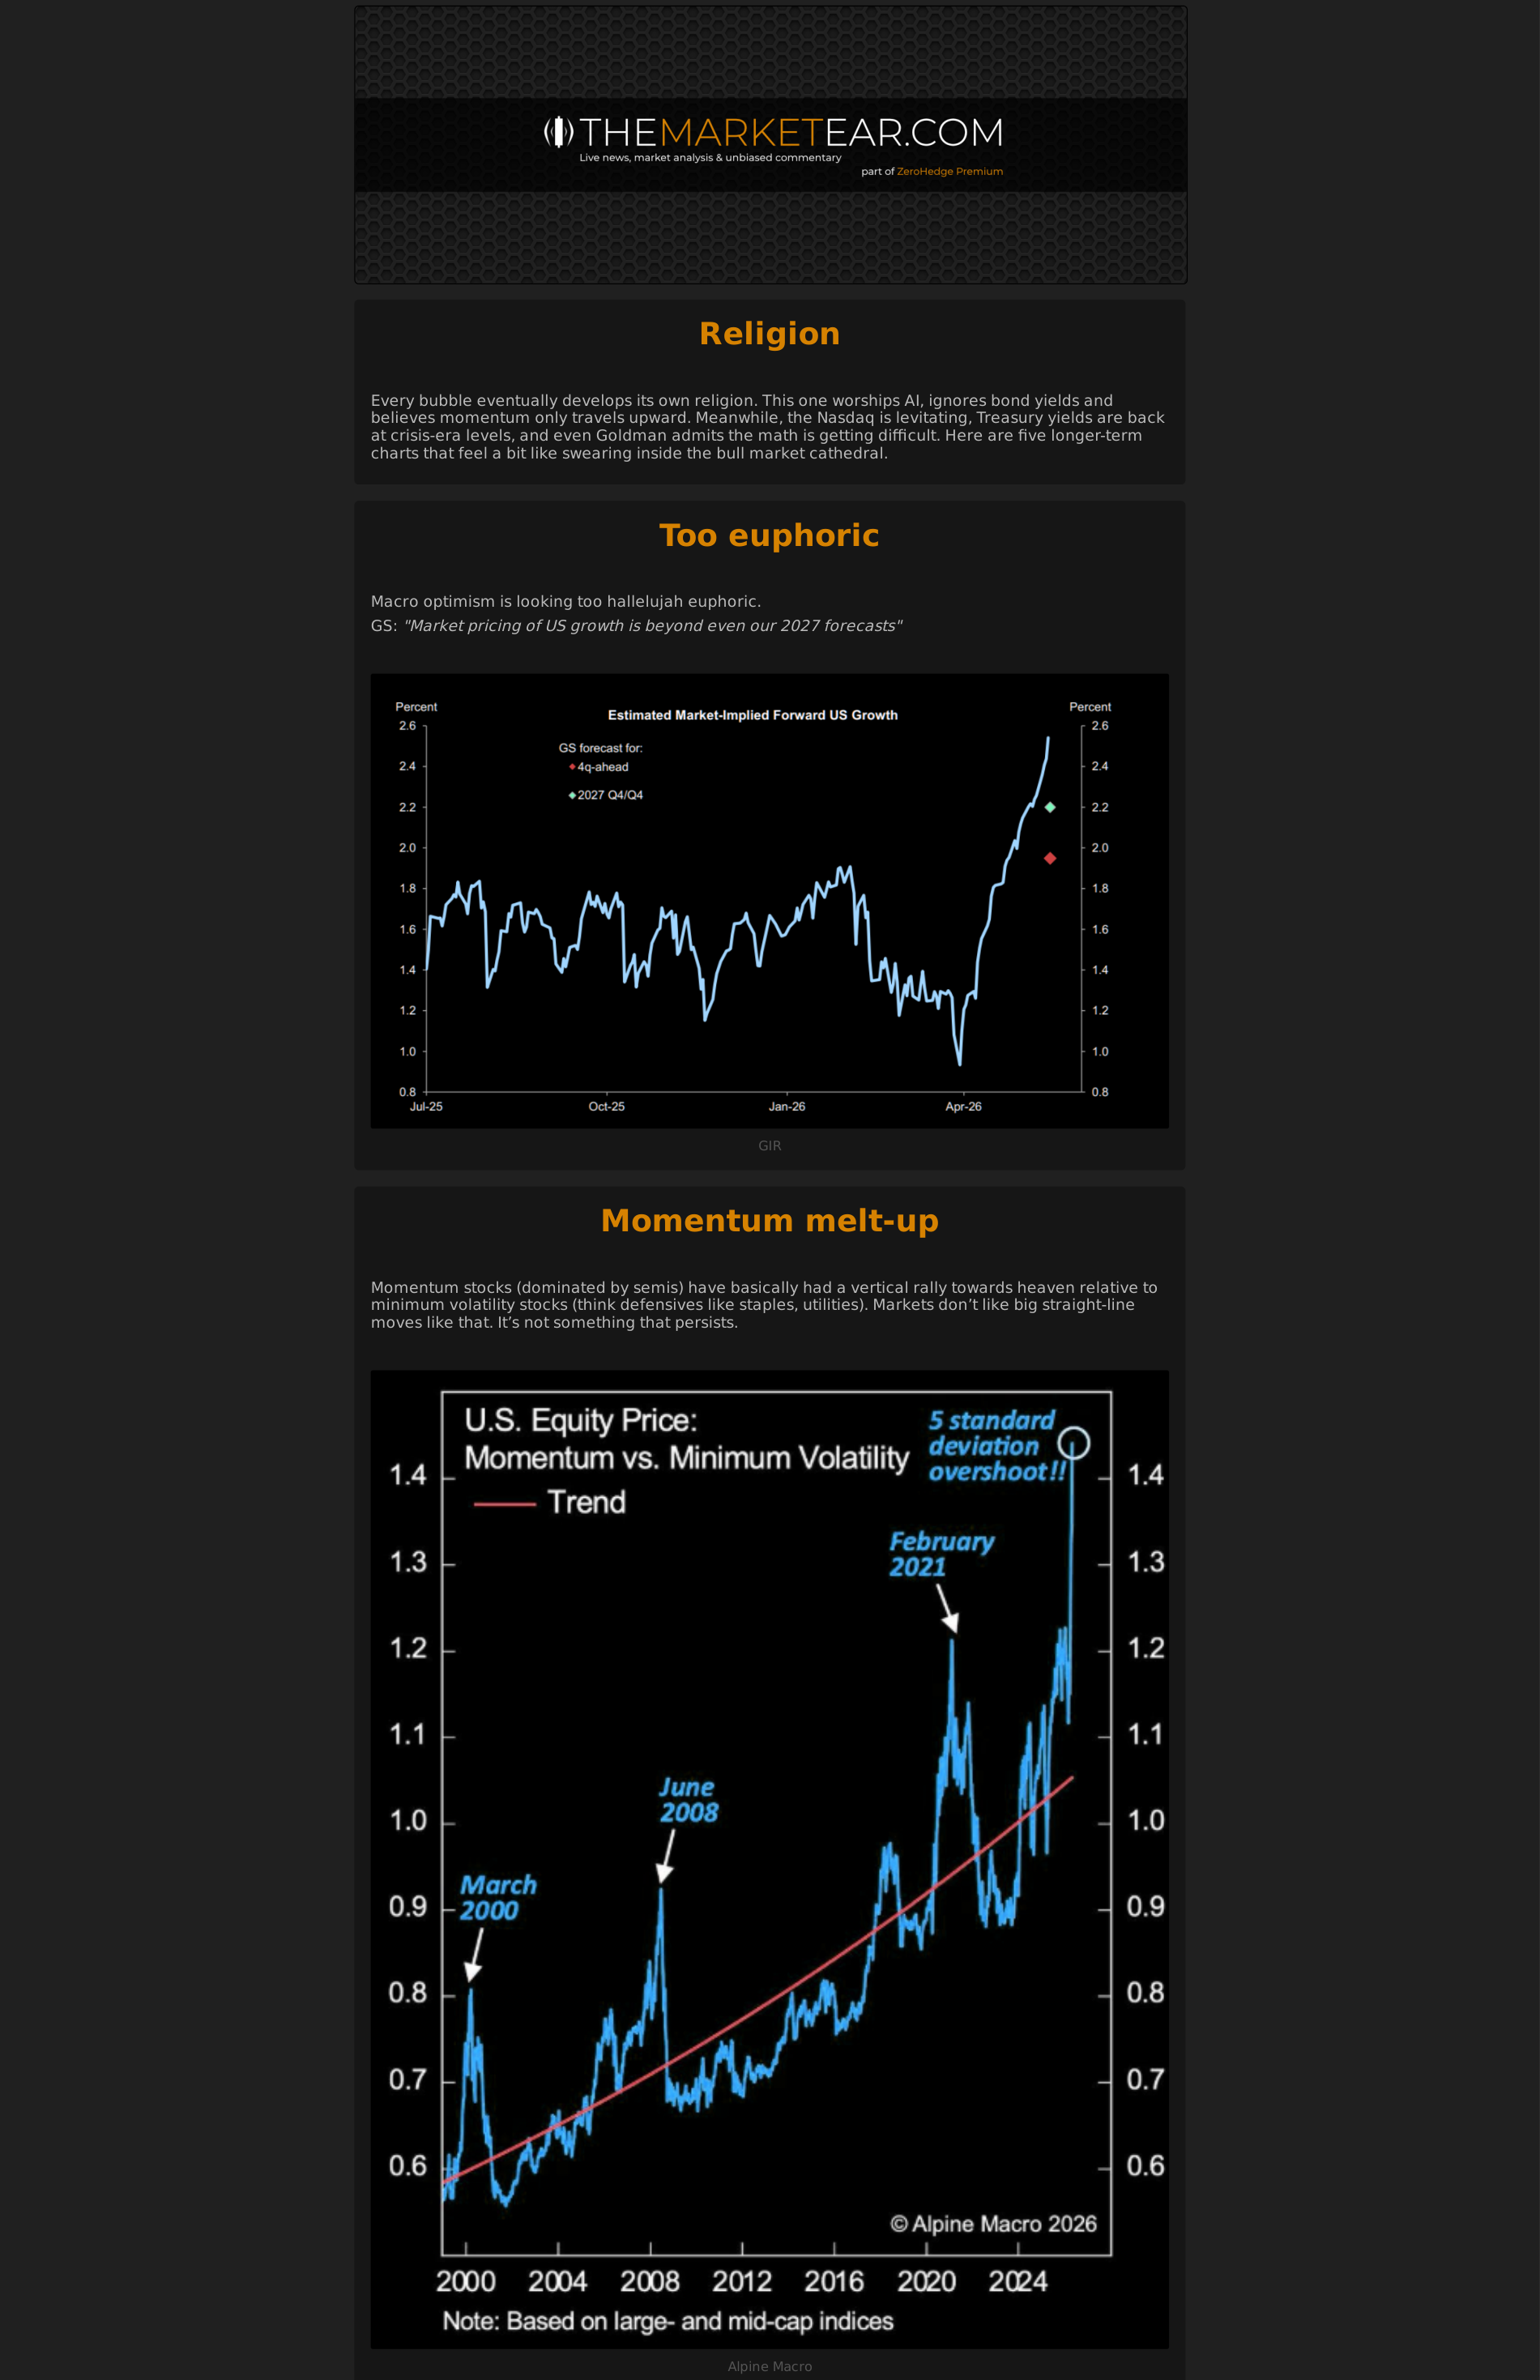
What it says: different this time: Religion Every bubble eventually develops its own religion. This one worships AI, ignores bond yields and believes momentum only travels upward. Meanwhile, the Nasdaq is levitating, Treasury yields are back at crisis-era levels, and even Goldman admits the...
Worldview update: The AI trade is no longer only about demand and model progress. The constraint is shifting toward cash-flow intensity, grid capacity, permitting, and public tolerance.
Portfolio/use: Map AI exposure through power, grid, utilities, gas, and capex beneficiaries; be careful where capex consumes free cash flow.
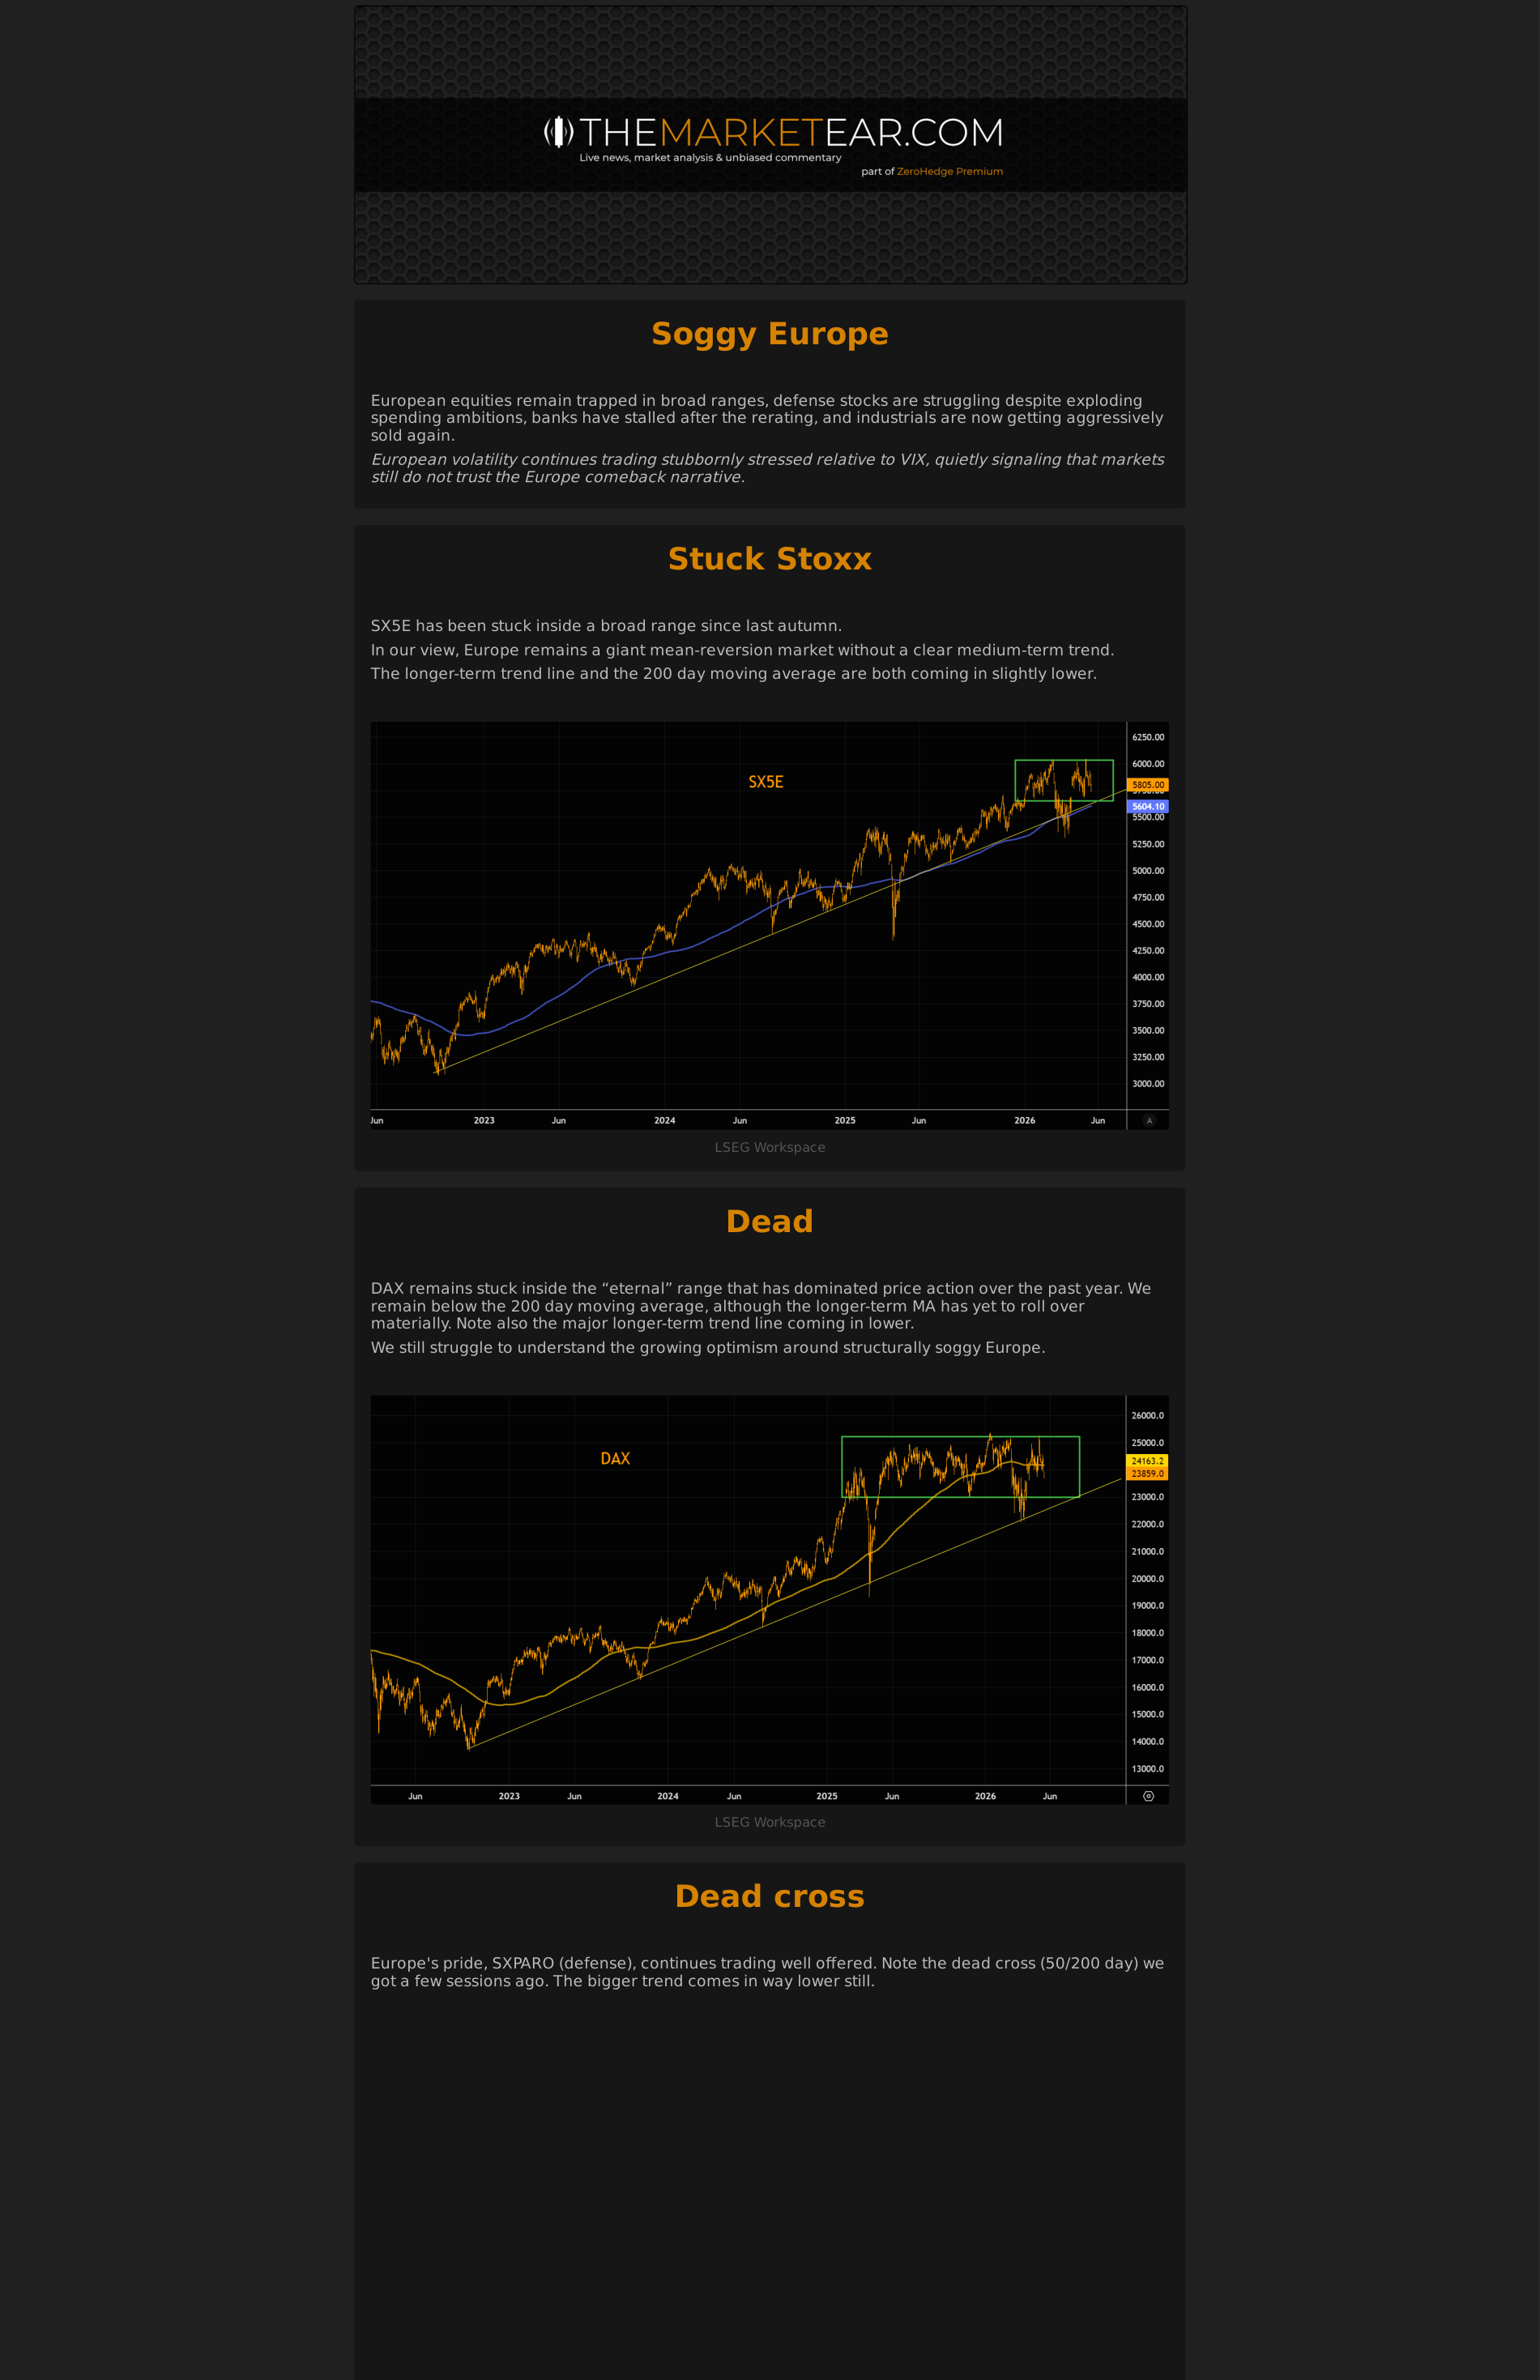
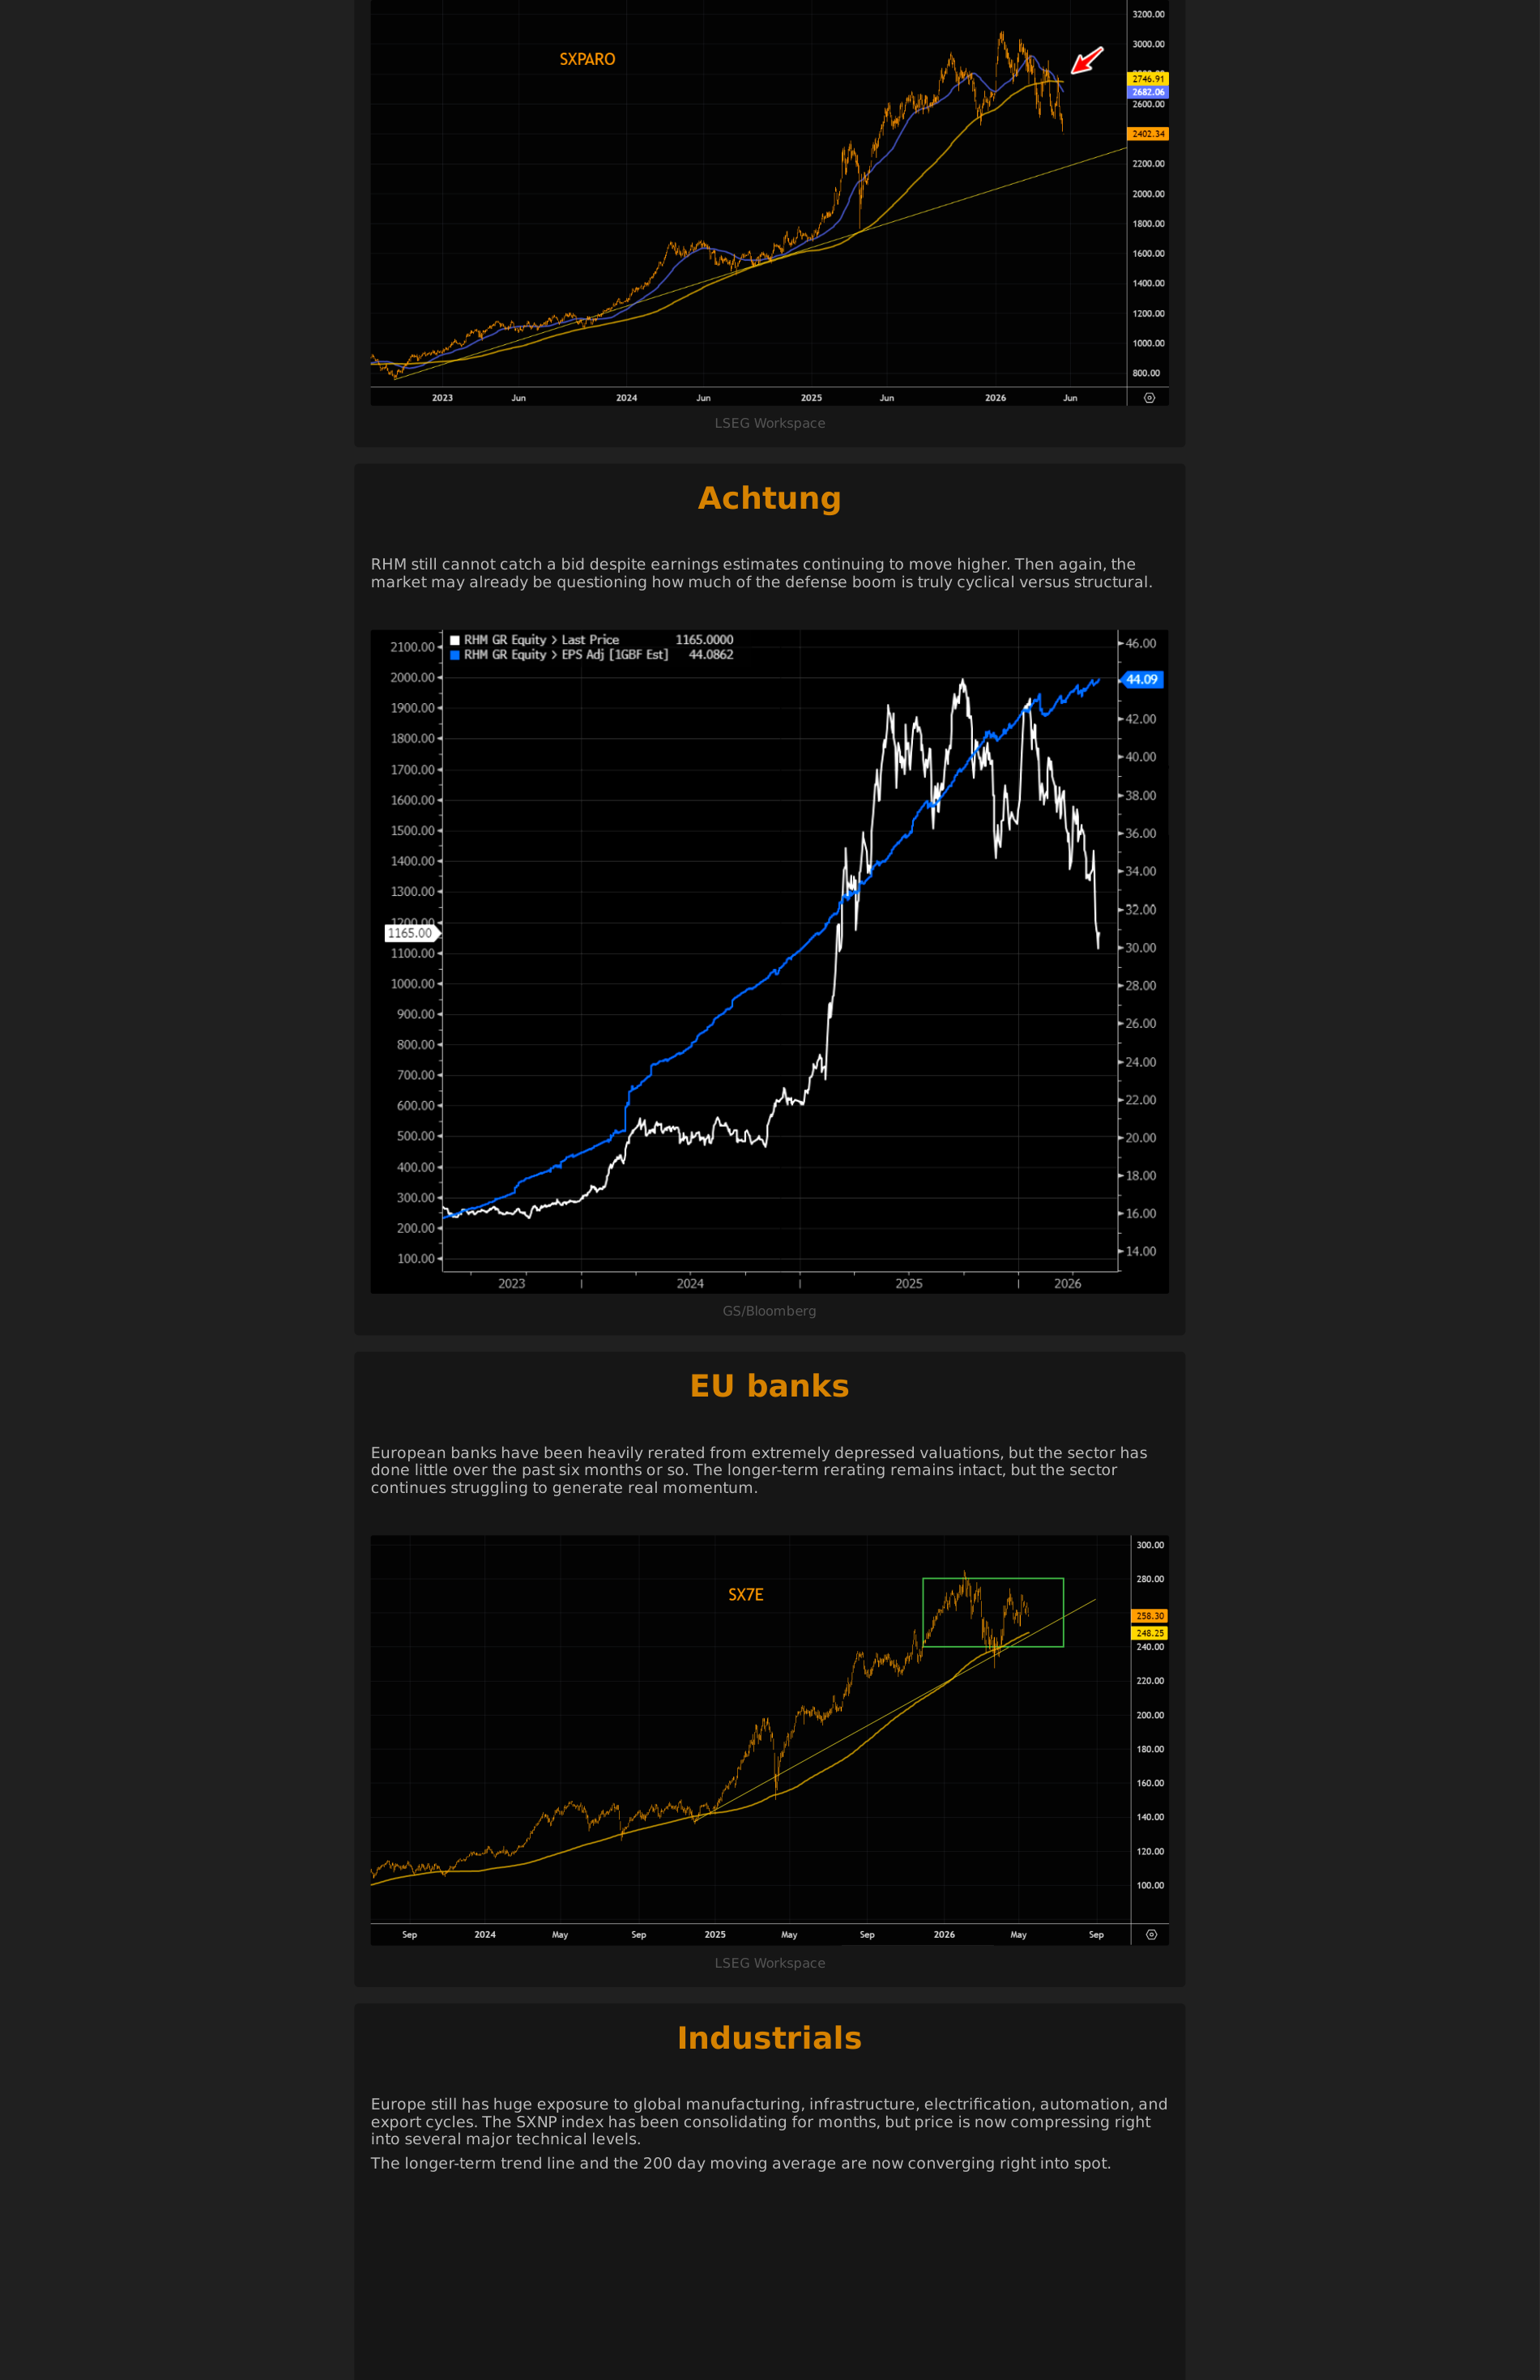
4. Europe has opportunity, but oil and FX can spoil it
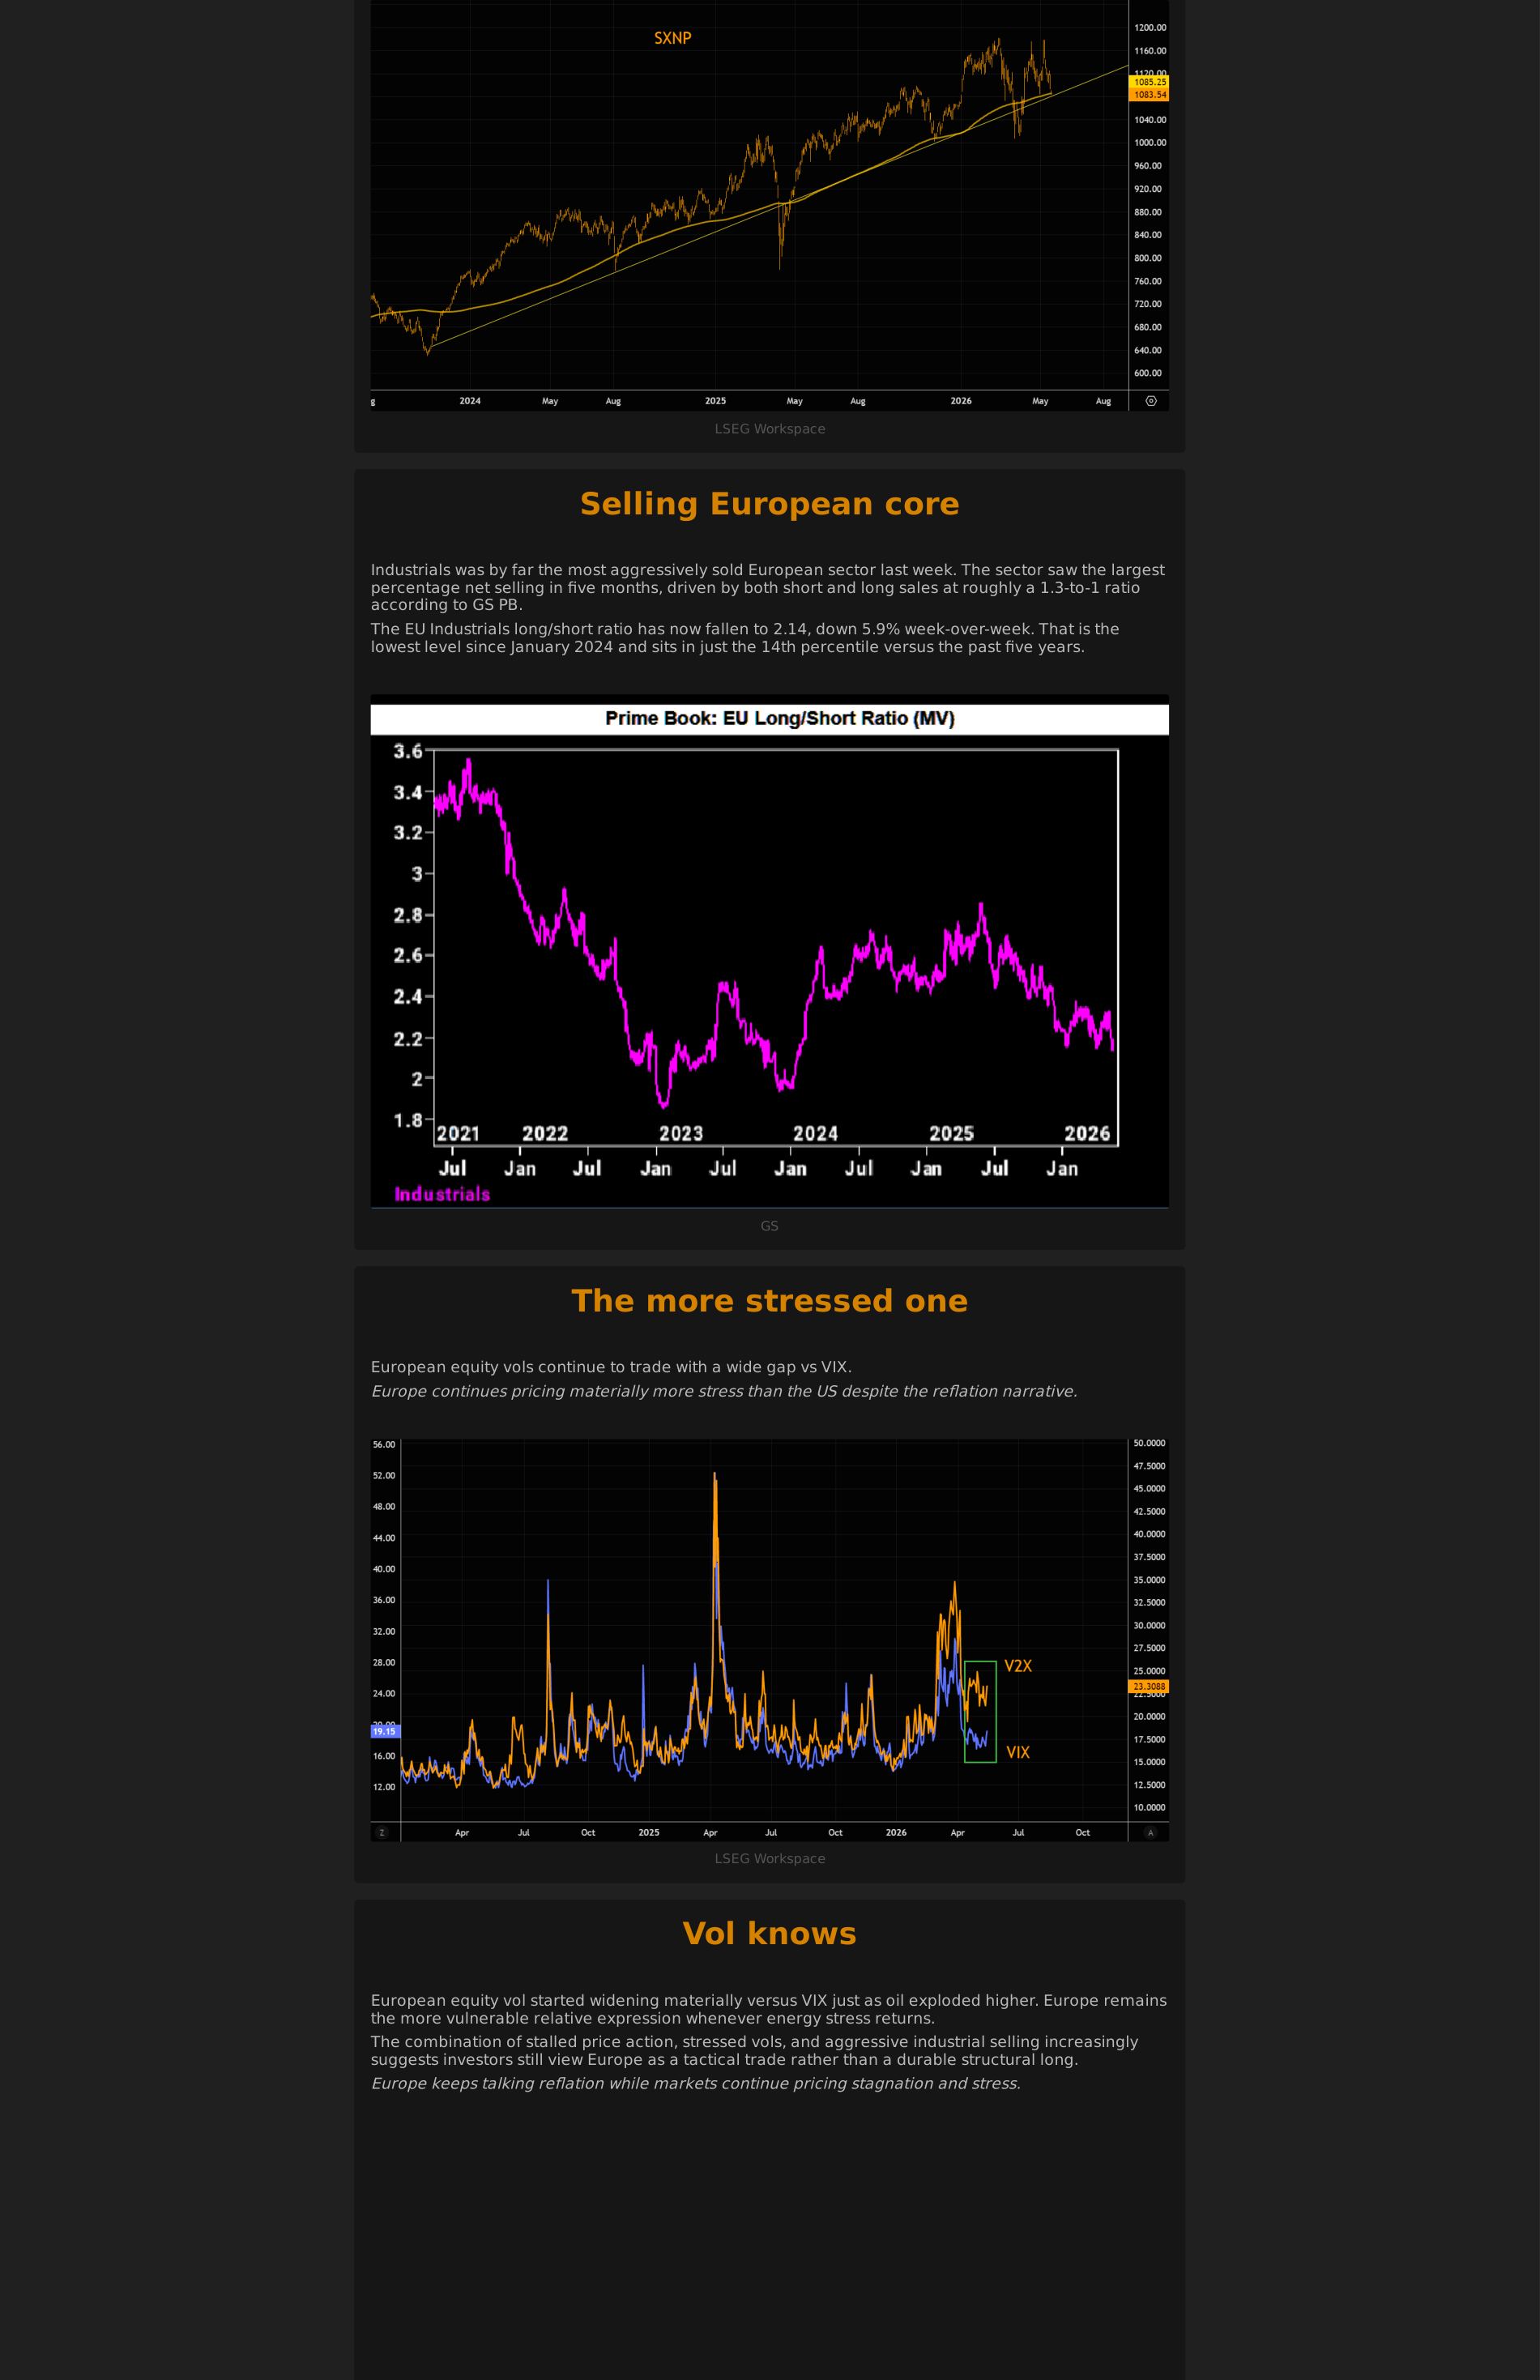
Page 3 | The Europe Comeback Trade Is Quietly Falling Apart
What it says: The Europe Comeback Trade Is Quietly Falling Apart: LSEG Workspace Selling European core Industrials was by far the most aggressively sold European sector last week. The sector saw the largest percentage net selling in five months, driven by both short and long sales at roughly a 1.3-to-1 ratio according to...
Worldview update: Europe has an earnings and under-positioning setup, but it is also more exposed to energy disappointment and currency pressure.
Portfolio/use: Prefer European longs with earnings momentum and lower energy sensitivity; hedge EUR risk when oil stress rises.
Daily Shot
Daily Shot was unavailable for this run.
Additional Chart Selection
JPM The J P Morgan View Higher for Longer in Oil and Rates Own AI
2 additional extracted charts
Chart 1
Page 3 | page-fallback | score 0.954
Chart 2
Page 5 | page-fallback | score 0.794
GS MORNING 1 Thoughts From the Floor 2 Dom Wilson s Latest 3
3 additional extracted charts
Chart 1
Page 1 | vector-cluster | score 0.740
Chart 2
Page 5 | page-fallback | score 0.707
Chart 3
Page 6 | page-fallback | score 0.771
markets macro the best thing I read this weekend
3 additional extracted charts
Chart 1
Page 2 | image-block | score 0.600
Chart 2
Page 4 | image-block | score 0.650
Chart 3
Page 5 | image-block | score 0.795
different this time
2 additional extracted charts
Chart 1
Page 1 | image-block | score 0.605
Chart 2
Page 2 | vector-cluster | score 0.802
Everyone Hates Banks
2 additional extracted charts
Chart 1
Page 1 | vector-cluster | score 0.753
Chart 2
Page 3 | vector-cluster | score 0.678
Tech Has A Rates Problem Again
3 additional extracted charts
Chart 1
Page 1 | vector-cluster | score 0.732
Chart 2
Page 2 | vector-cluster | score 0.832
Chart 3
Page 3 | vector-cluster | score 0.806
The Europe Comeback Trade Is Quietly Falling Apart