Trading_and_investment_papers plus Daily Shot when available.
Window PDFs7
Chart Extracts21
Top Charts3
Daily Shotskipped
Bottom line: This packet is the one-stop morning read: curated chart evidence first, Daily Shot context second, and source links at the end.
Top Charts
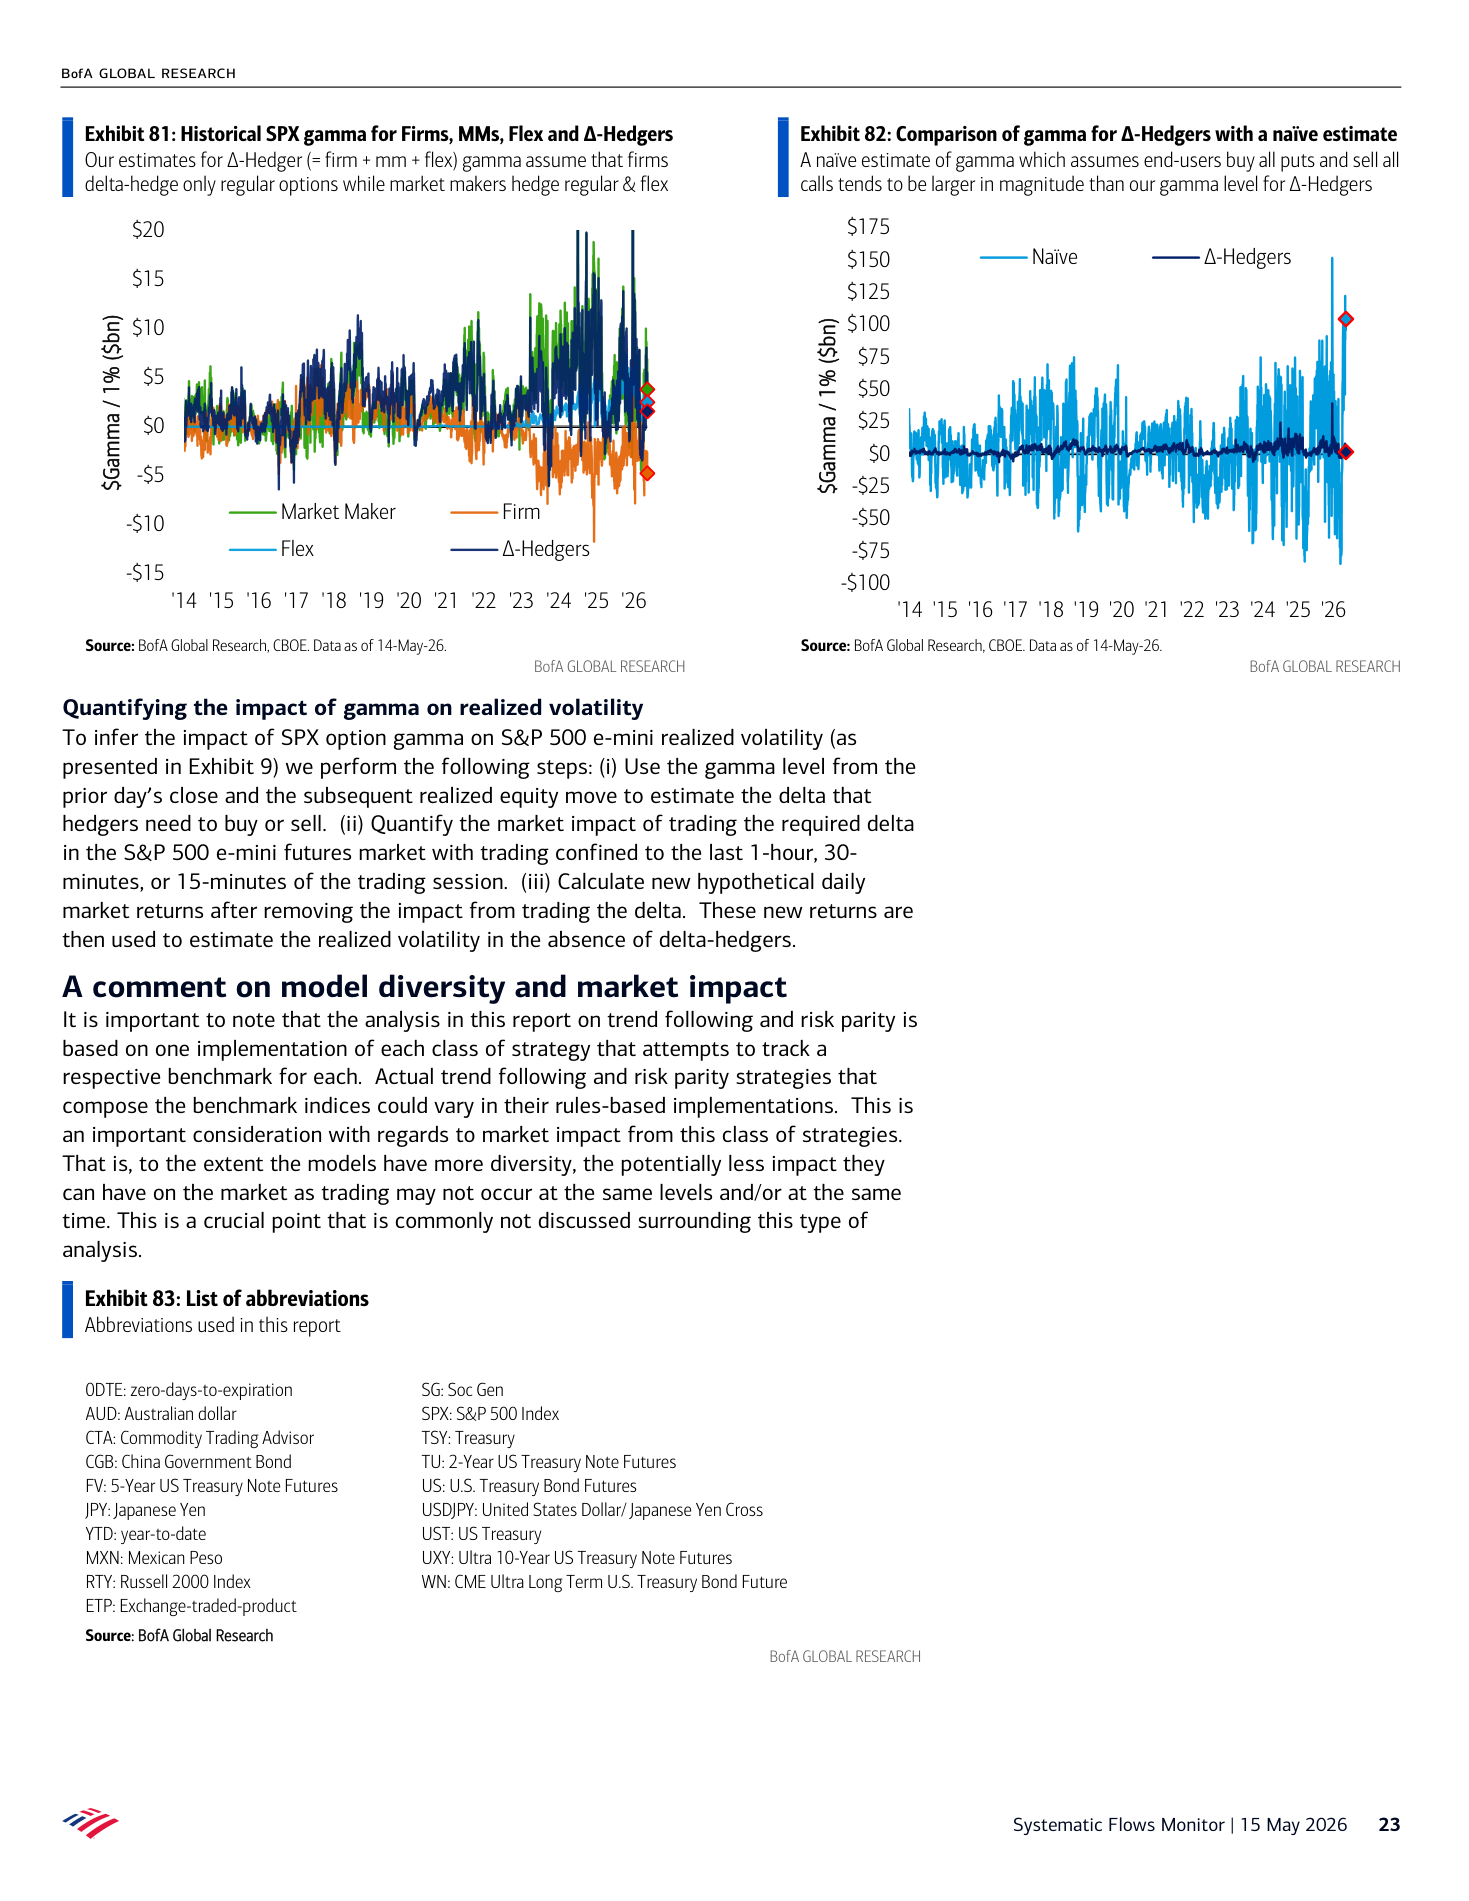
1. BofA Systematic Flows Monitor Systematic flows stabilize as equity: Options are shaping the path of the underlying
Page 23 | BofA Systematic Flows Monitor Systematic flows stabilize as equity
What it says: BofA Systematic Flows Monitor Systematic flows stabilize as equity: Systematic Flows Monitor | 15 May 2026 23 Exhibit 81: Historical SPX gamma for Firms, MMs, Flex and ∆-Hedgers Our estimates for ∆-Hedger (= firm + mm + flex) gamma assume that firms delta-hedge only regular options while market makers hedge regular & flex S...
Worldview update: The rally has become more flow-mechanical. Fundamentals still matter, but call demand, vol compression, and dealer positioning are first-order timing variables.
Portfolio/use: Favor defined-risk upside and start adding downside while hedges are ignored.
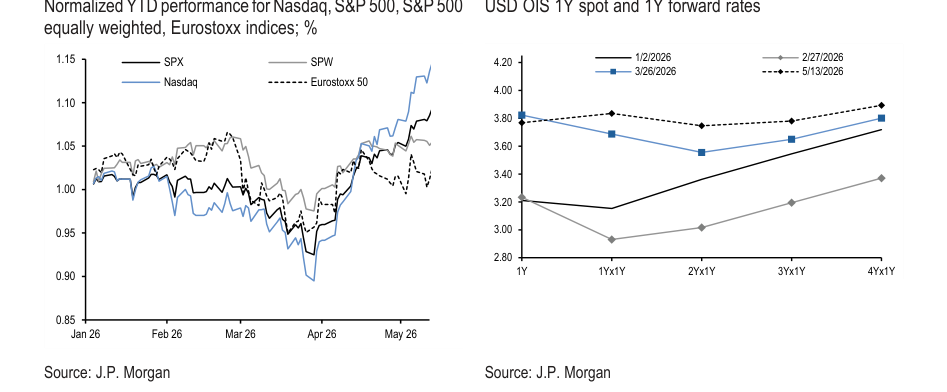
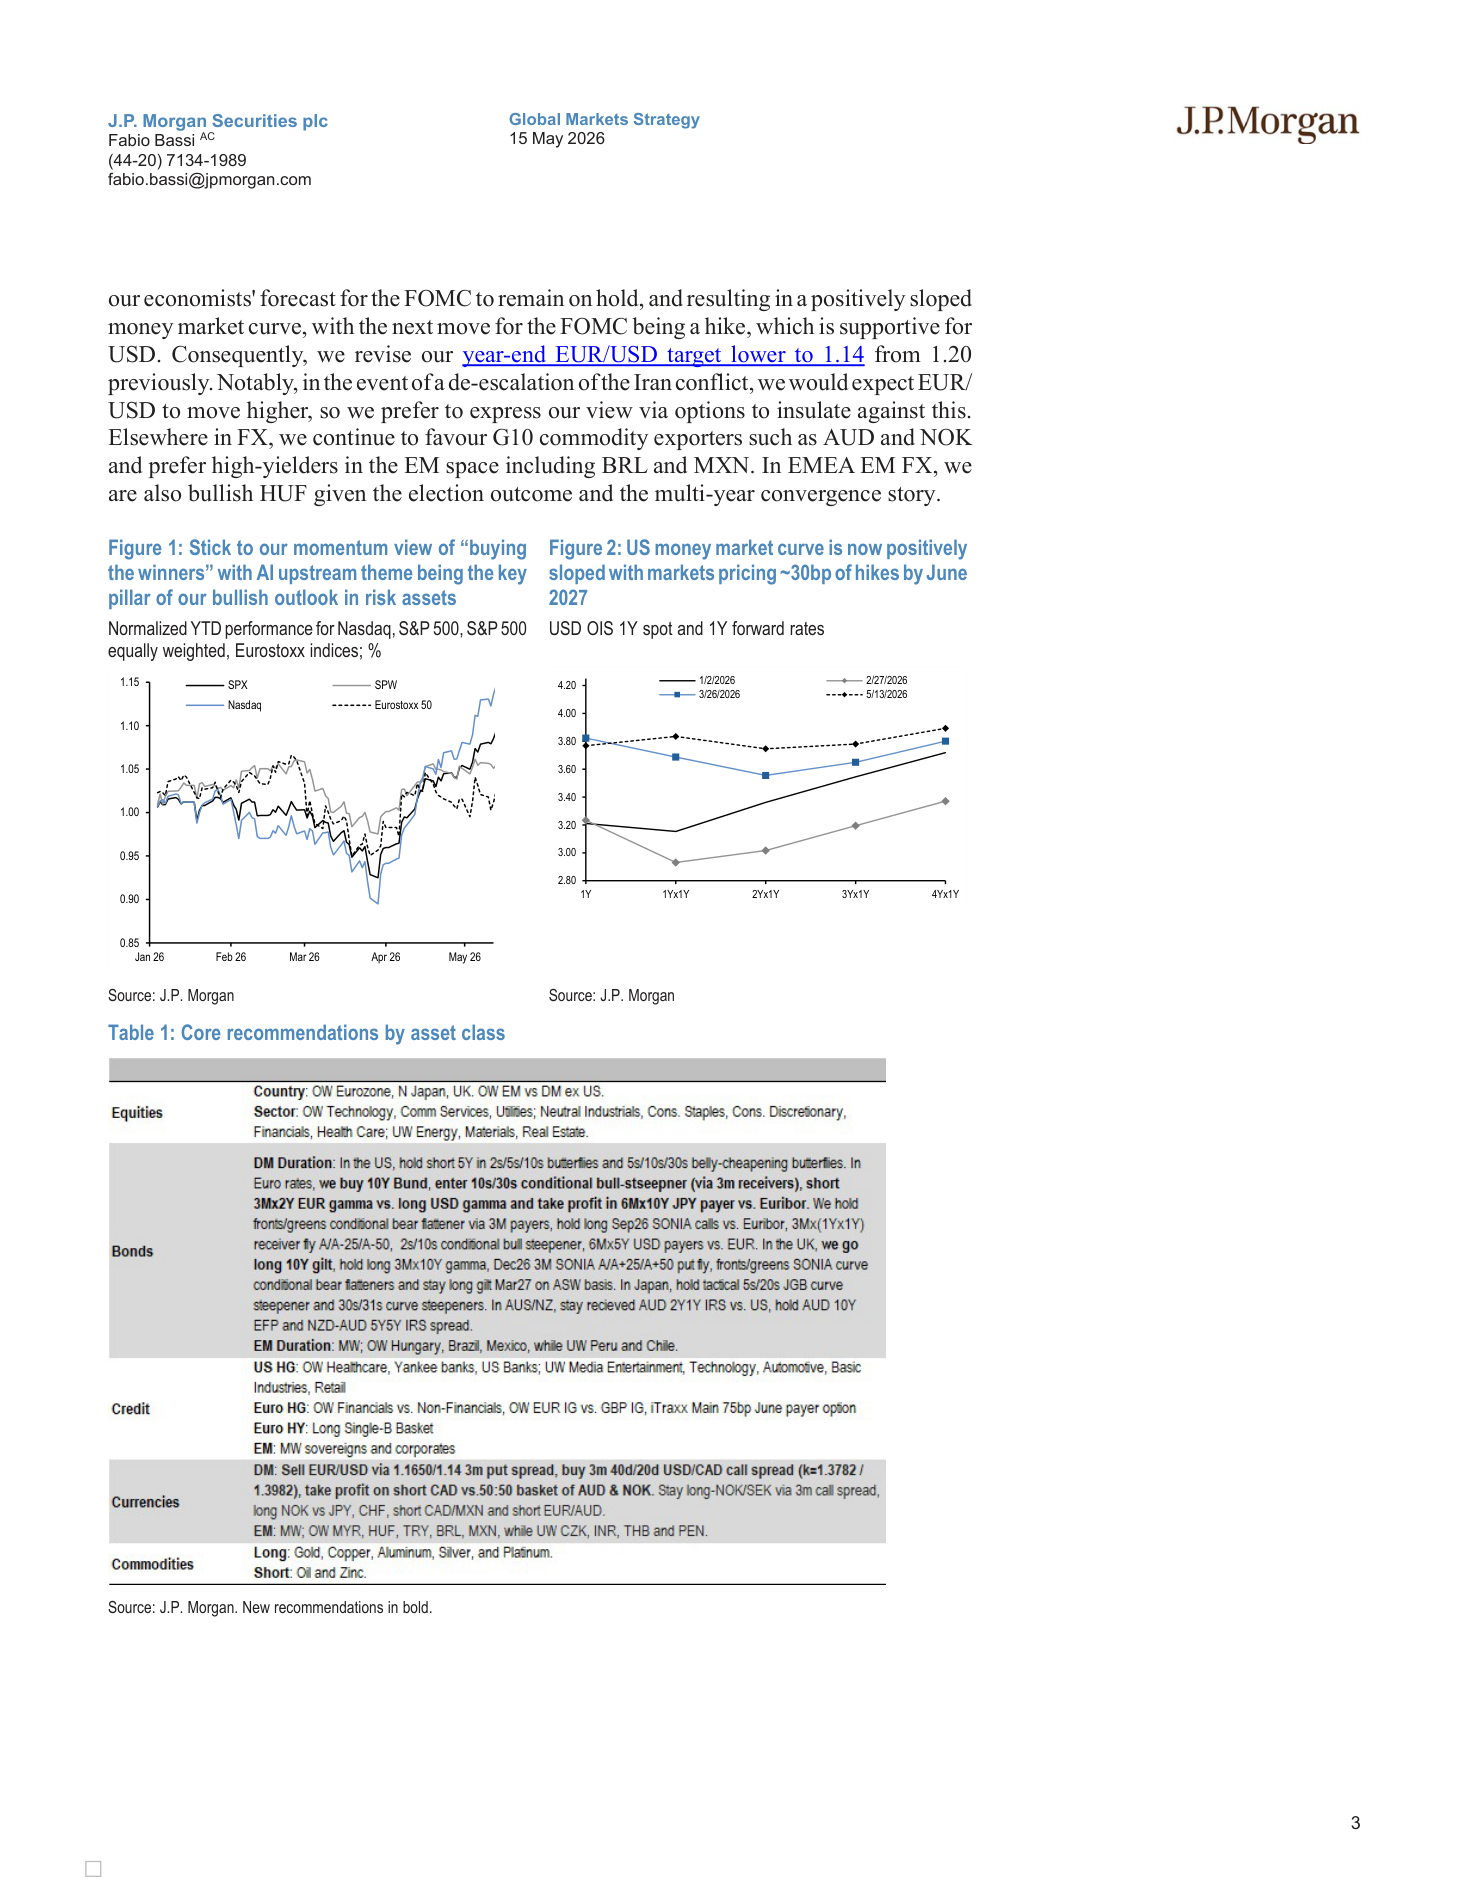
2. JPM The J P Morgan View Higher for Longer in Oil and Rates Own AI: Oil stress is feeding rates, while equities are looking through it
Page 3 | JPM The J P Morgan View Higher for Longer in Oil and Rates Own AI
What it says: JPM The J P Morgan View Higher for Longer in Oil and Rates Own AI: Figure 1: Stick to our momentum view of “buying the winners” with AI upstream theme being the key pillar of our bullish outlook in risk assets Normalized YTD performance for Nasdaq, S&P 500, S&P 500 equally weighted, Eurostoxx indices; % 0.85 0.90 0.95 1.00...
Worldview update: The cleaner market signal is the cross-asset divergence: oil stress has mattered for rates, but equities are already looking through it. That calm is fragile if energy pressure starts feeding inflation or growth expectations again.
Portfolio/use: Track Brent, rates, and equity correlation together; use oil/rates stress as the warning light rather than treating headlines in isolation.
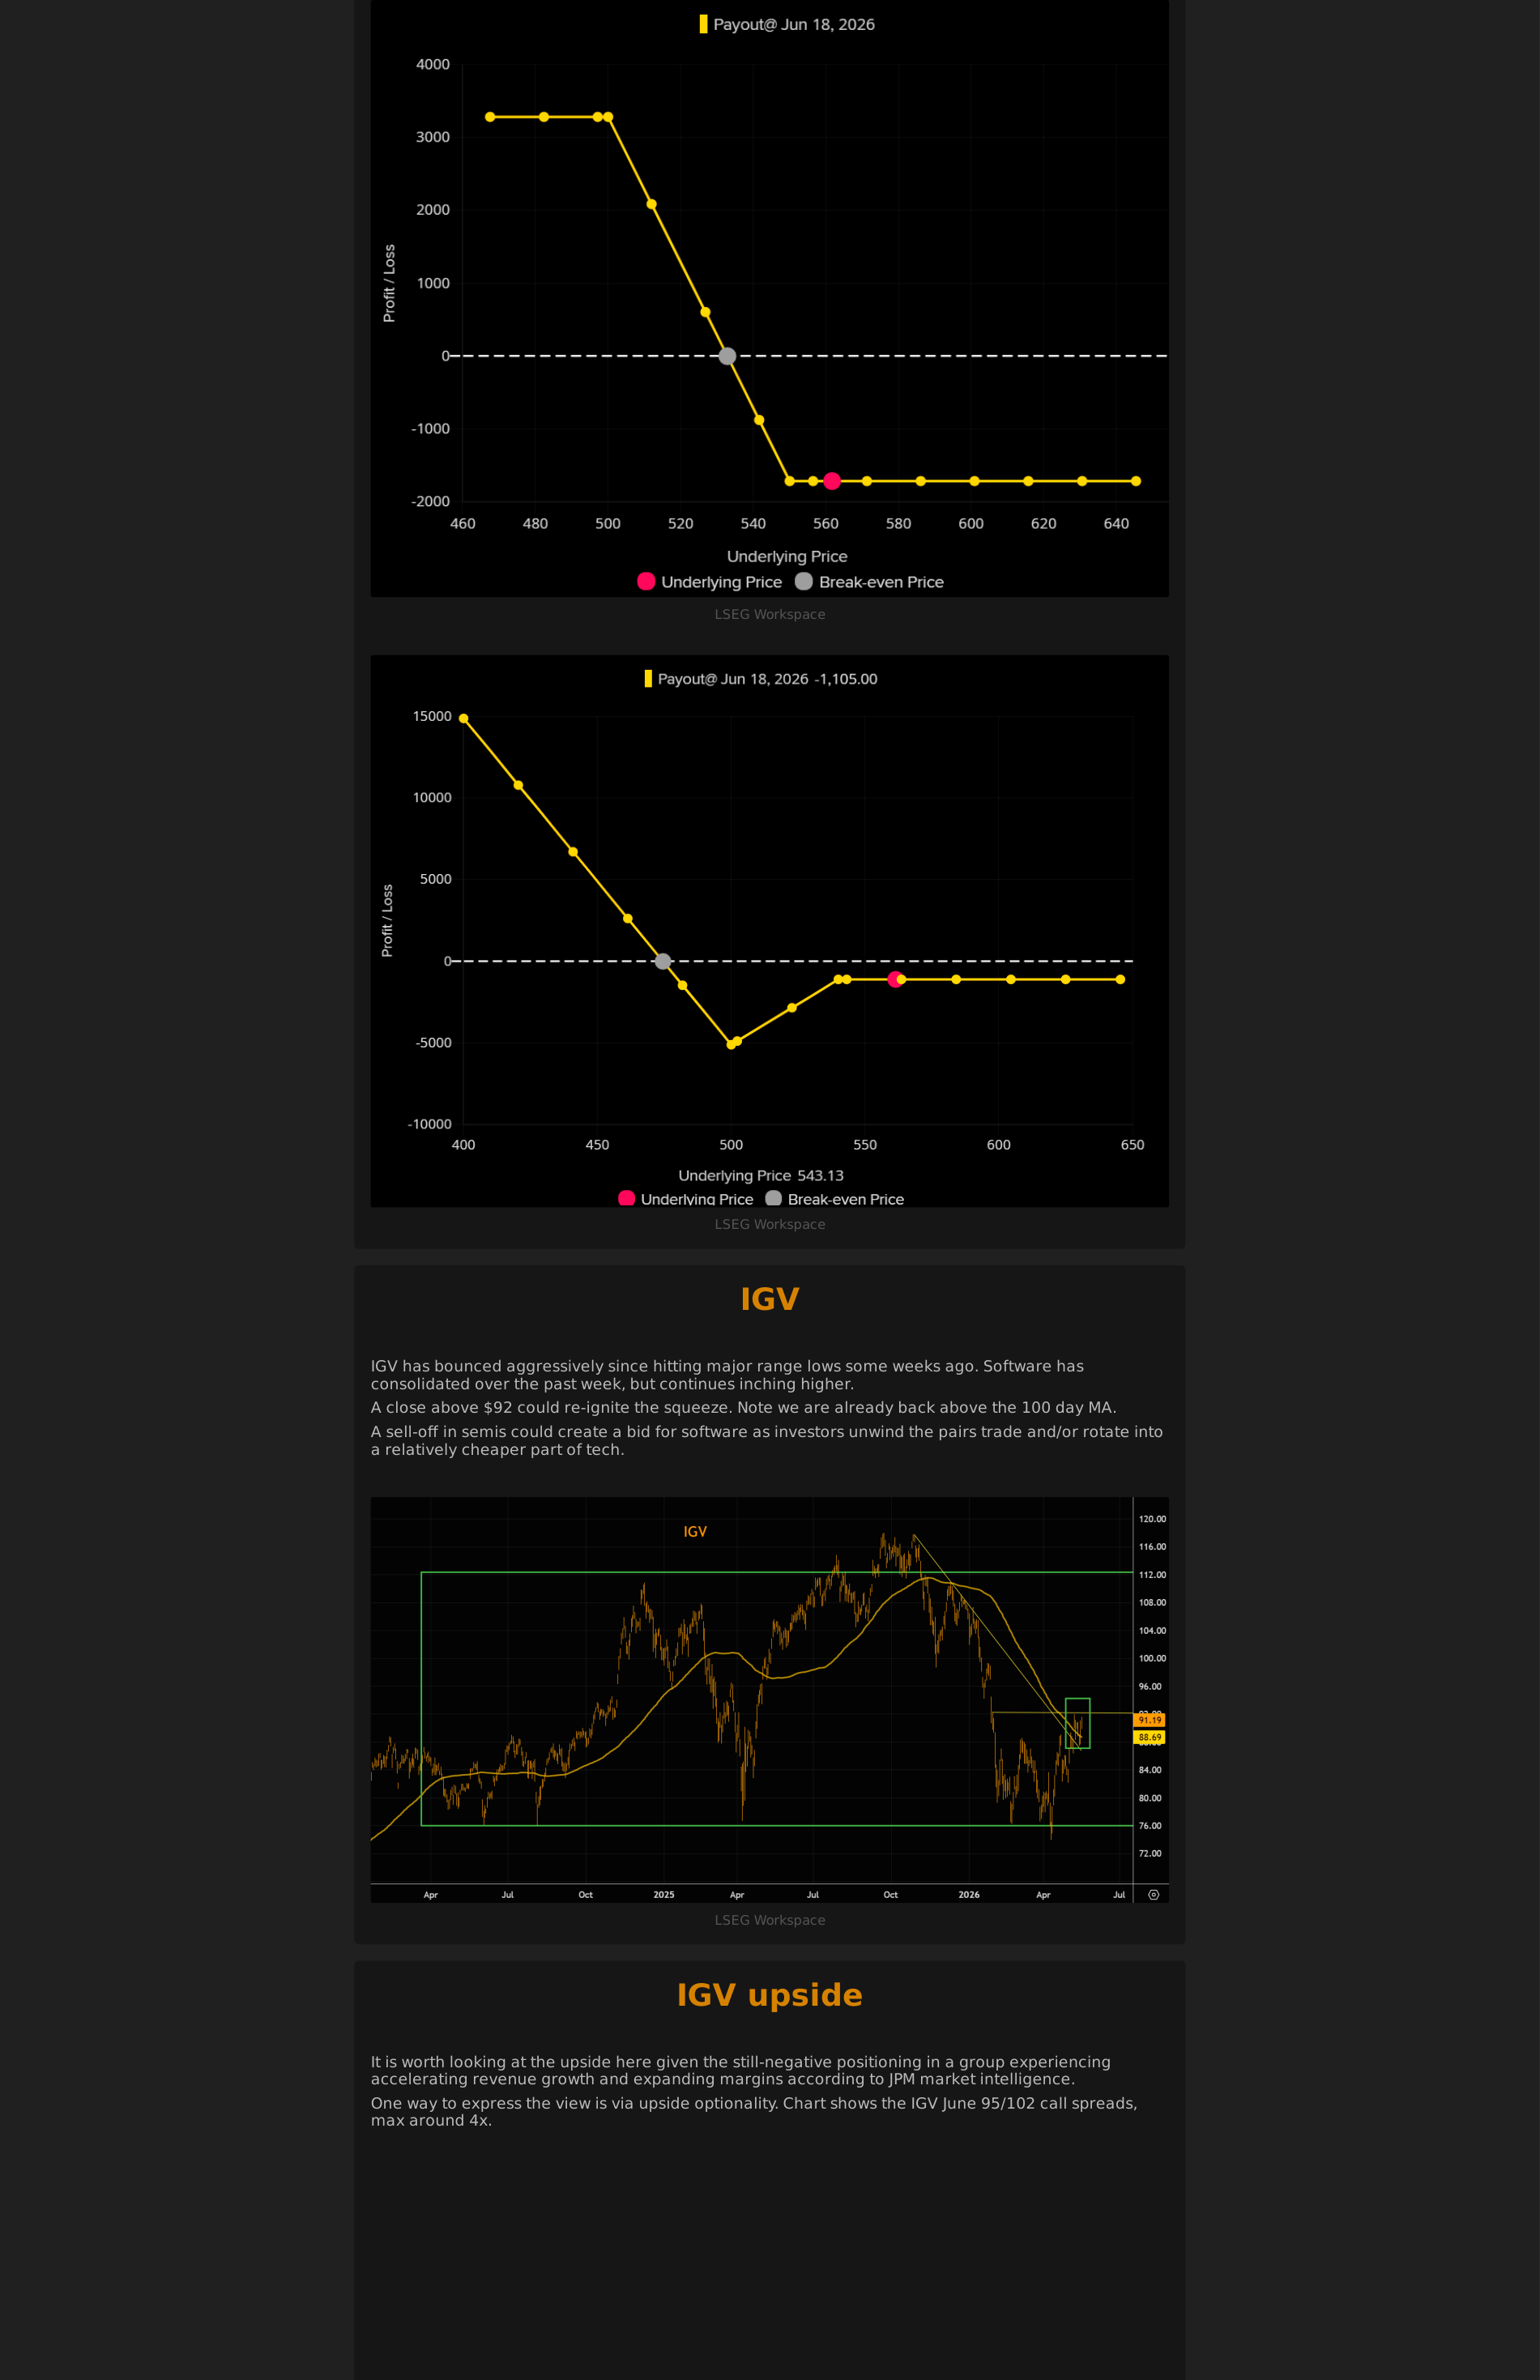
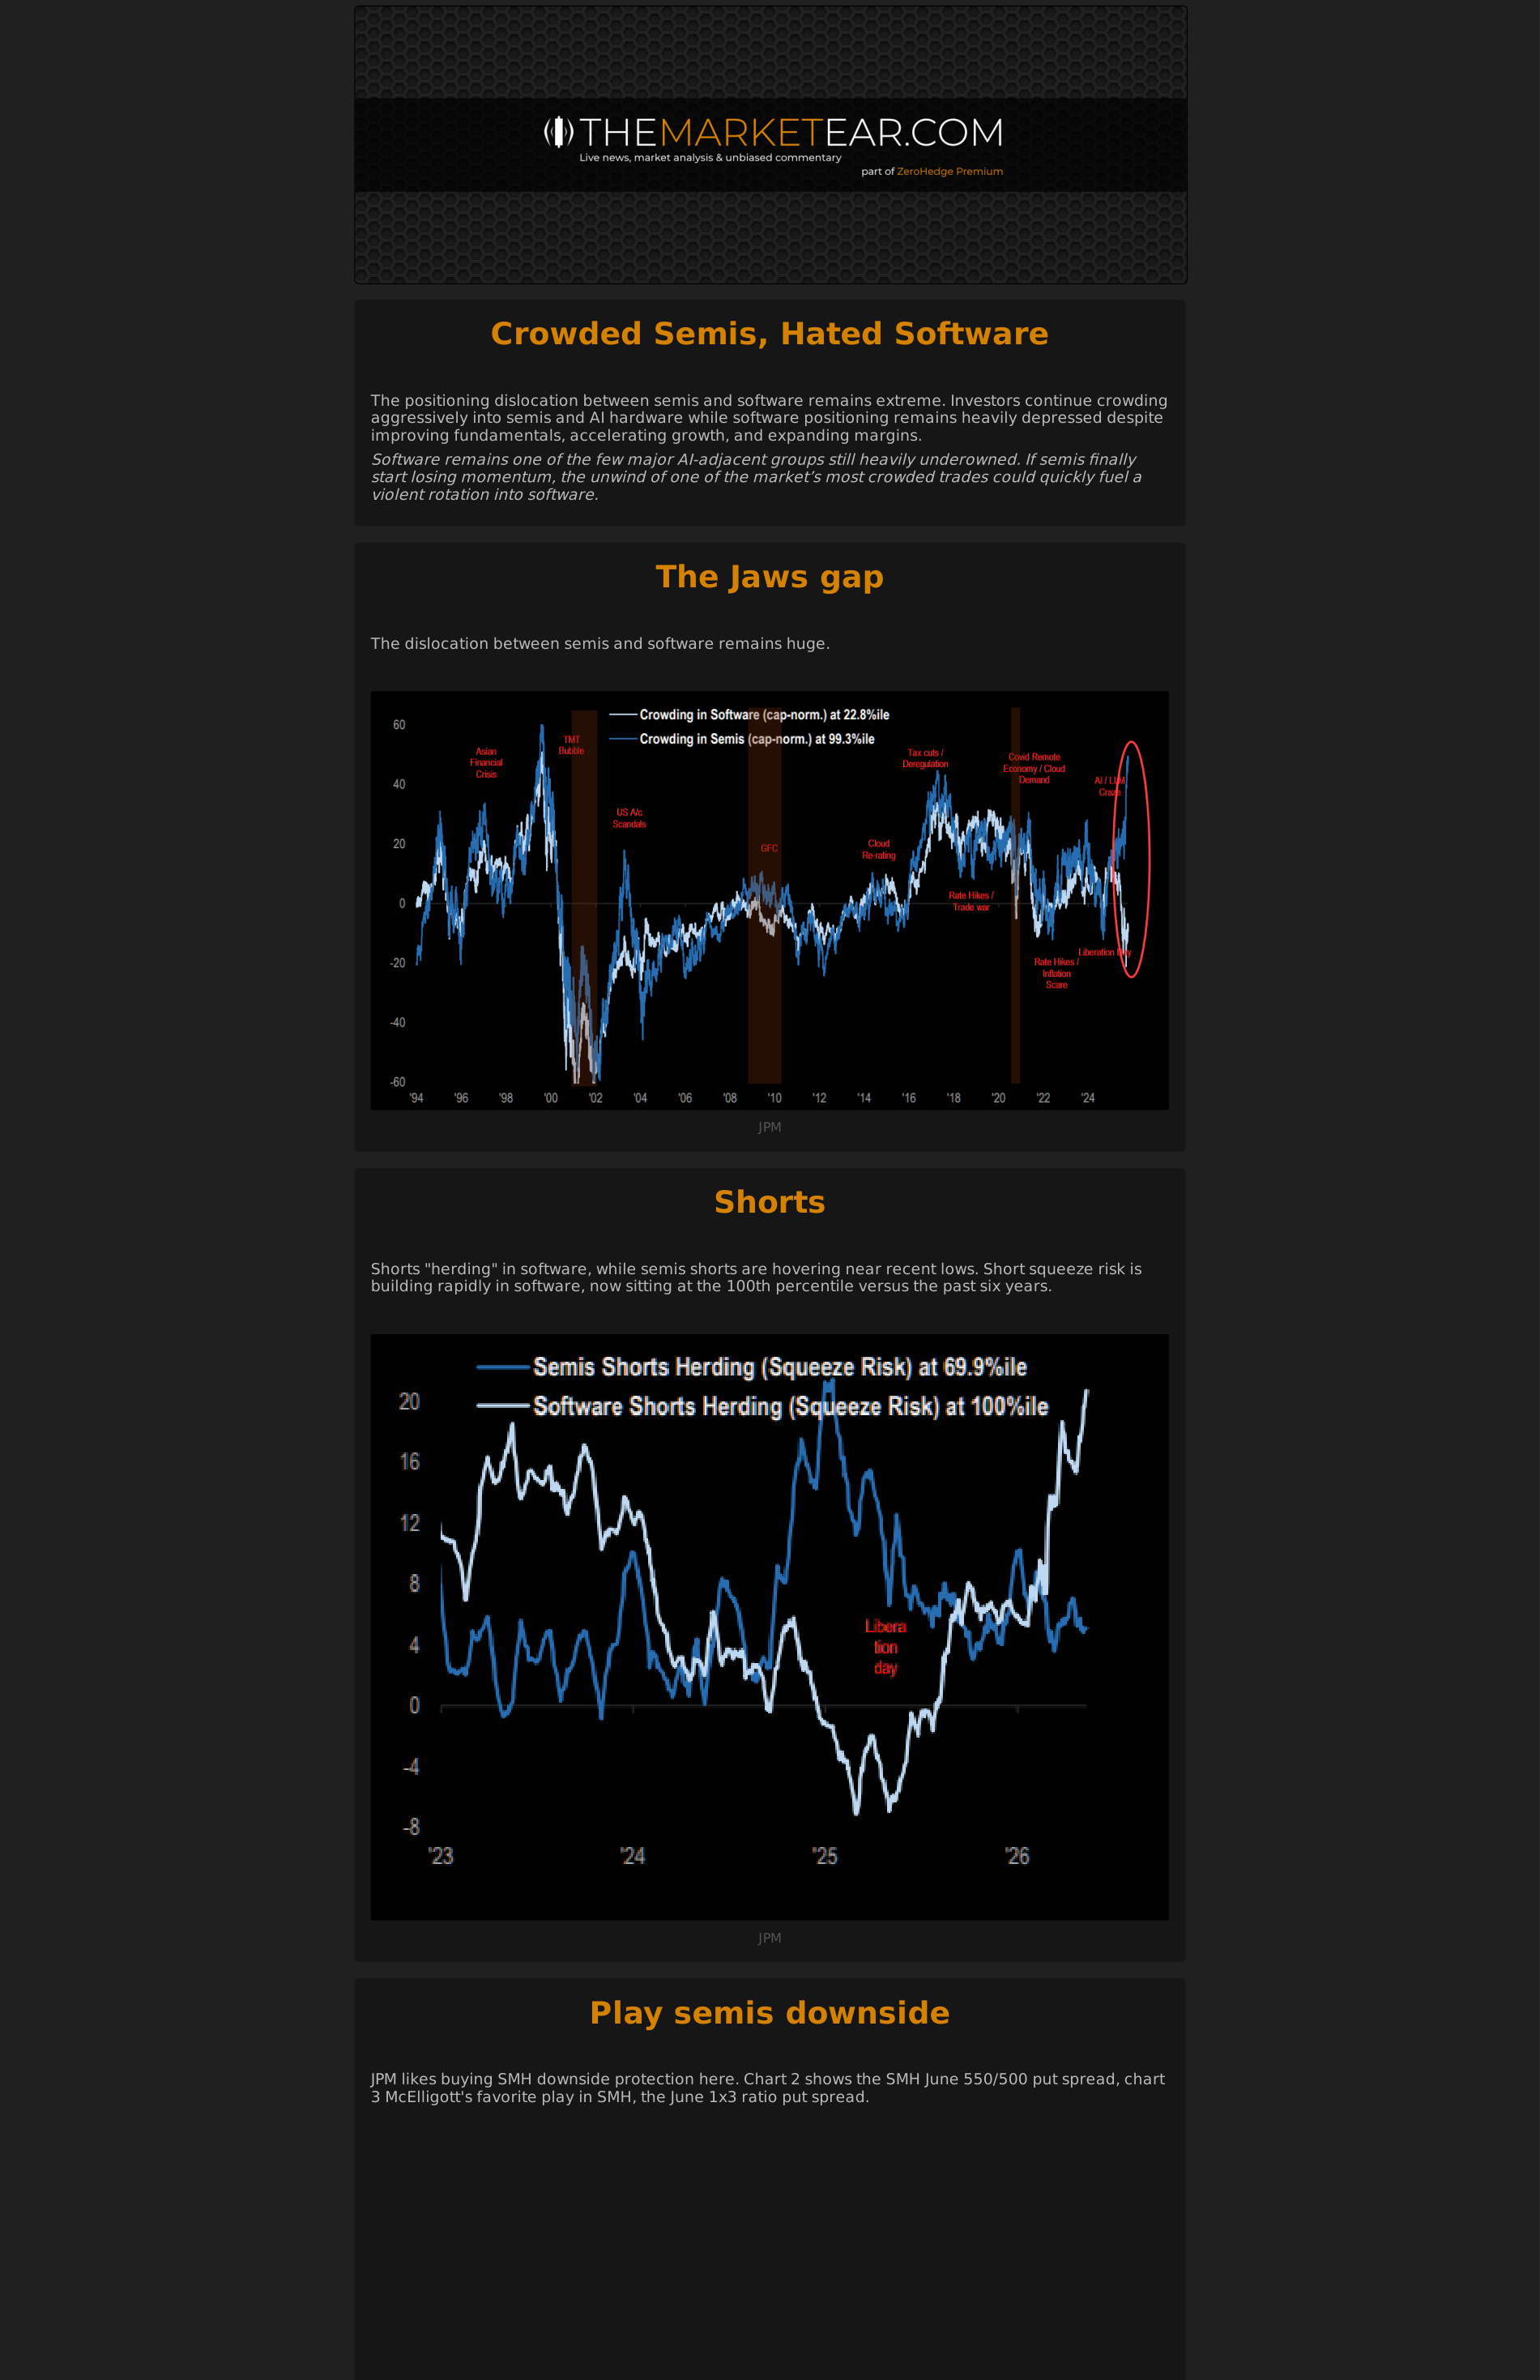
3. One Of Tech s Biggest Rotations Is Brewing: AI is becoming a capex, power, and politics story
Page 2 | One Of Tech s Biggest Rotations Is Brewing
What it says: One Of Tech s Biggest Rotations Is Brewing: LSEG Workspace LSEG Workspace IGV IGV has bounced aggressively since hitting major range lows some weeks ago. Software has consolidated over the past week, but continues inching higher. A close above $92 could re-ignite the squeeze. Note we are already back...
Worldview update: The AI trade is no longer only about demand and model progress. The constraint is shifting toward cash-flow intensity, grid capacity, permitting, and public tolerance.
Portfolio/use: Map AI exposure through power, grid, utilities, gas, and capex beneficiaries; be careful where capex consumes free cash flow.
Daily Shot
Daily Shot was unavailable for this run.
Additional Chart Selection
One Of Tech s Biggest Rotations Is Brewing
2 additional extracted charts
Chart 1
Page 1 | vector-cluster | score 0.898
Chart 2
Page 3 | vector-cluster | score 0.717
weekly mash --1
3 additional extracted charts
Chart 1
Page 1 | vector-cluster | score 0.729
Chart 2
Page 5 | image-block | score 0.621
Chart 3
Page 6 | image-block | score 0.675
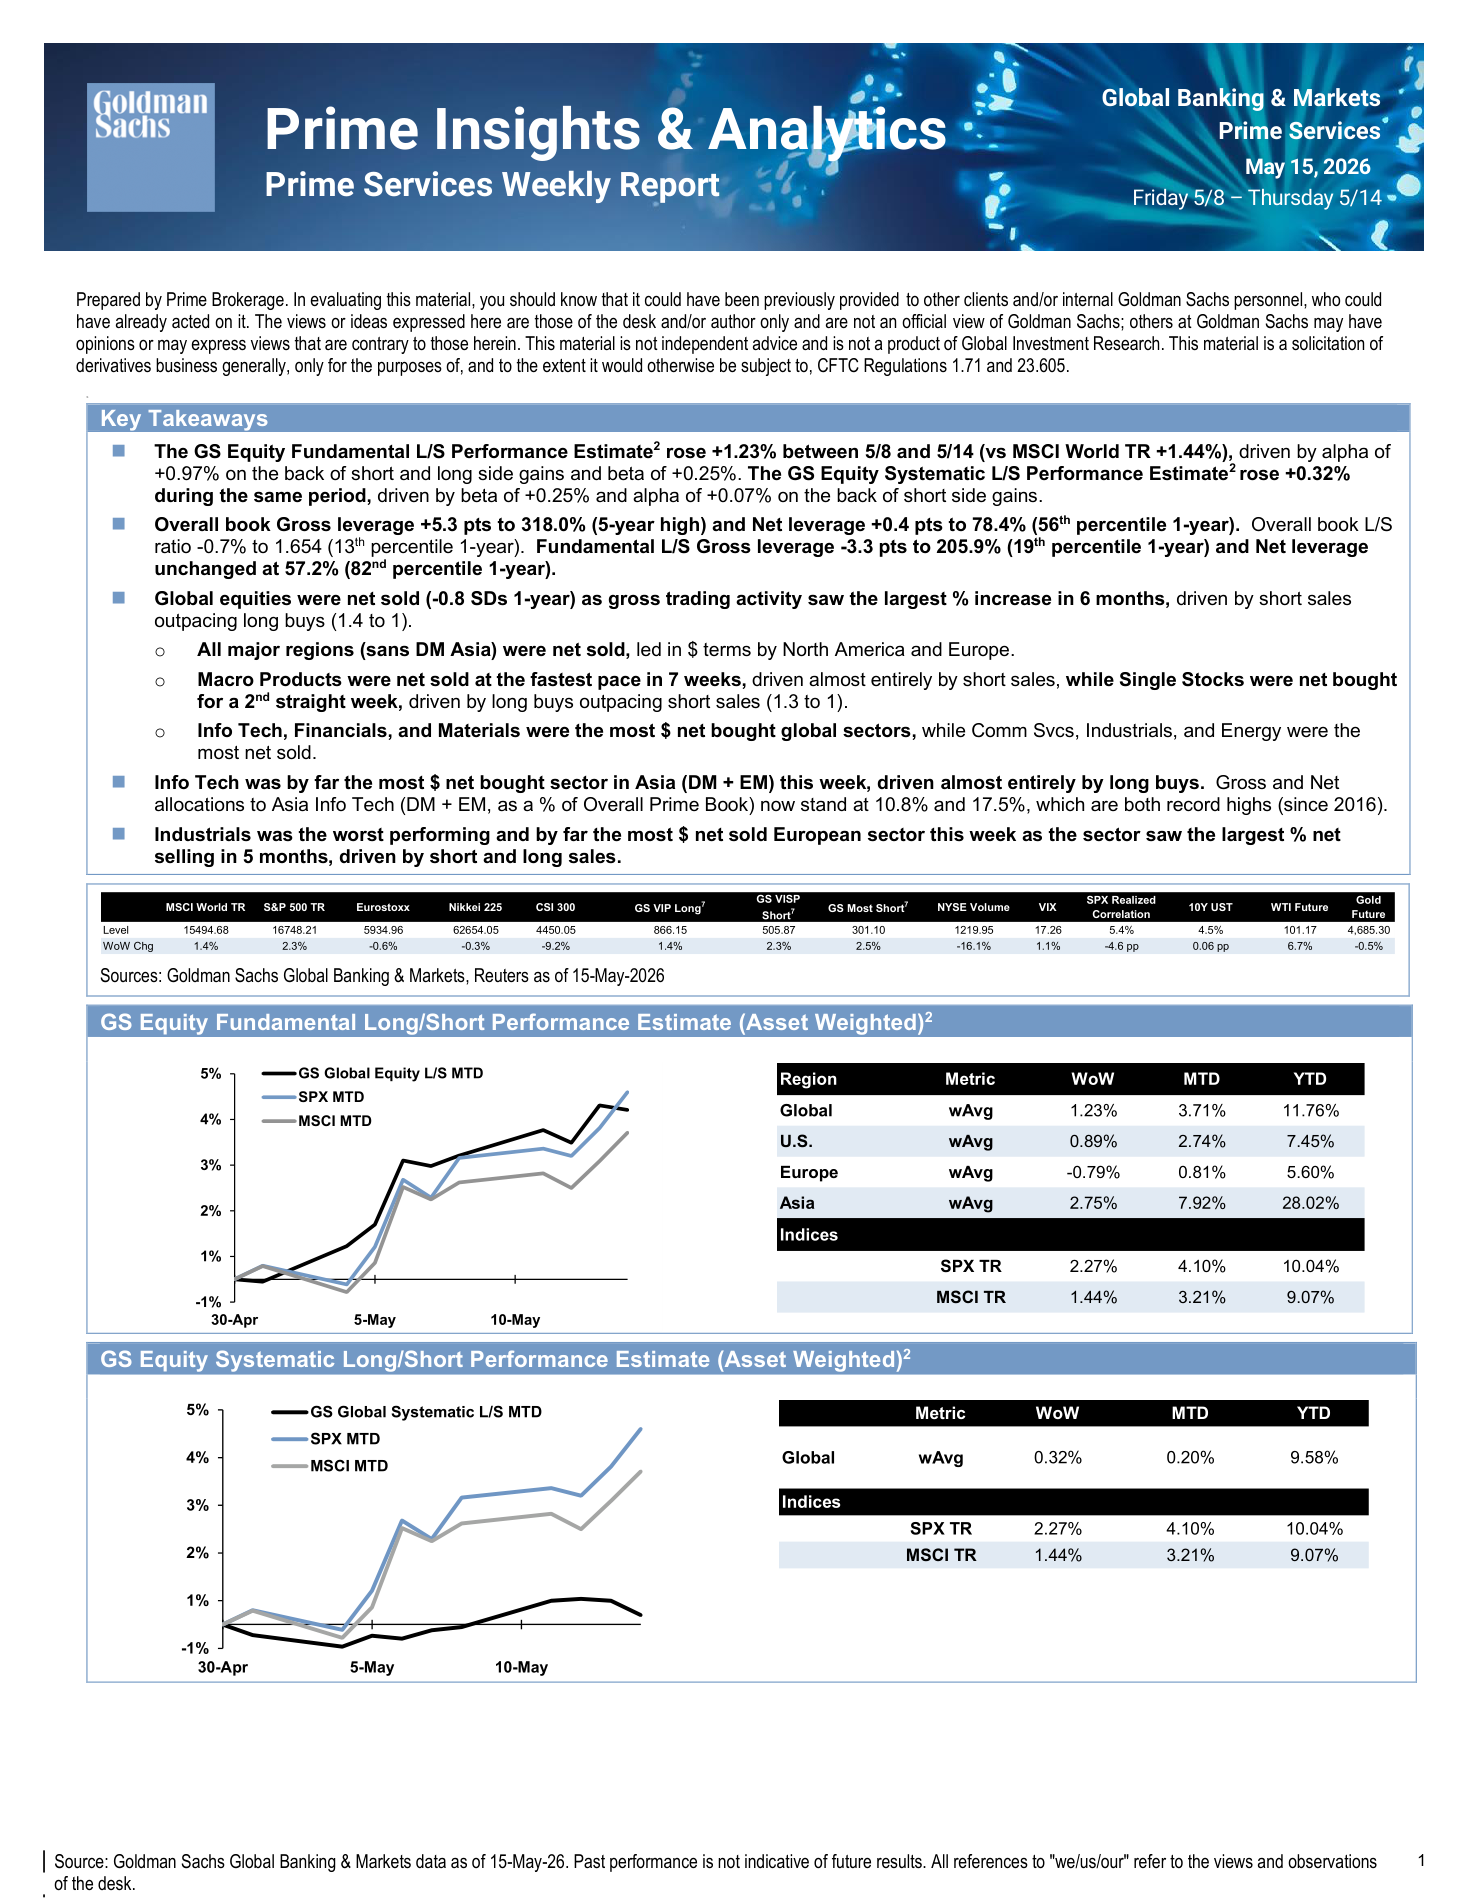
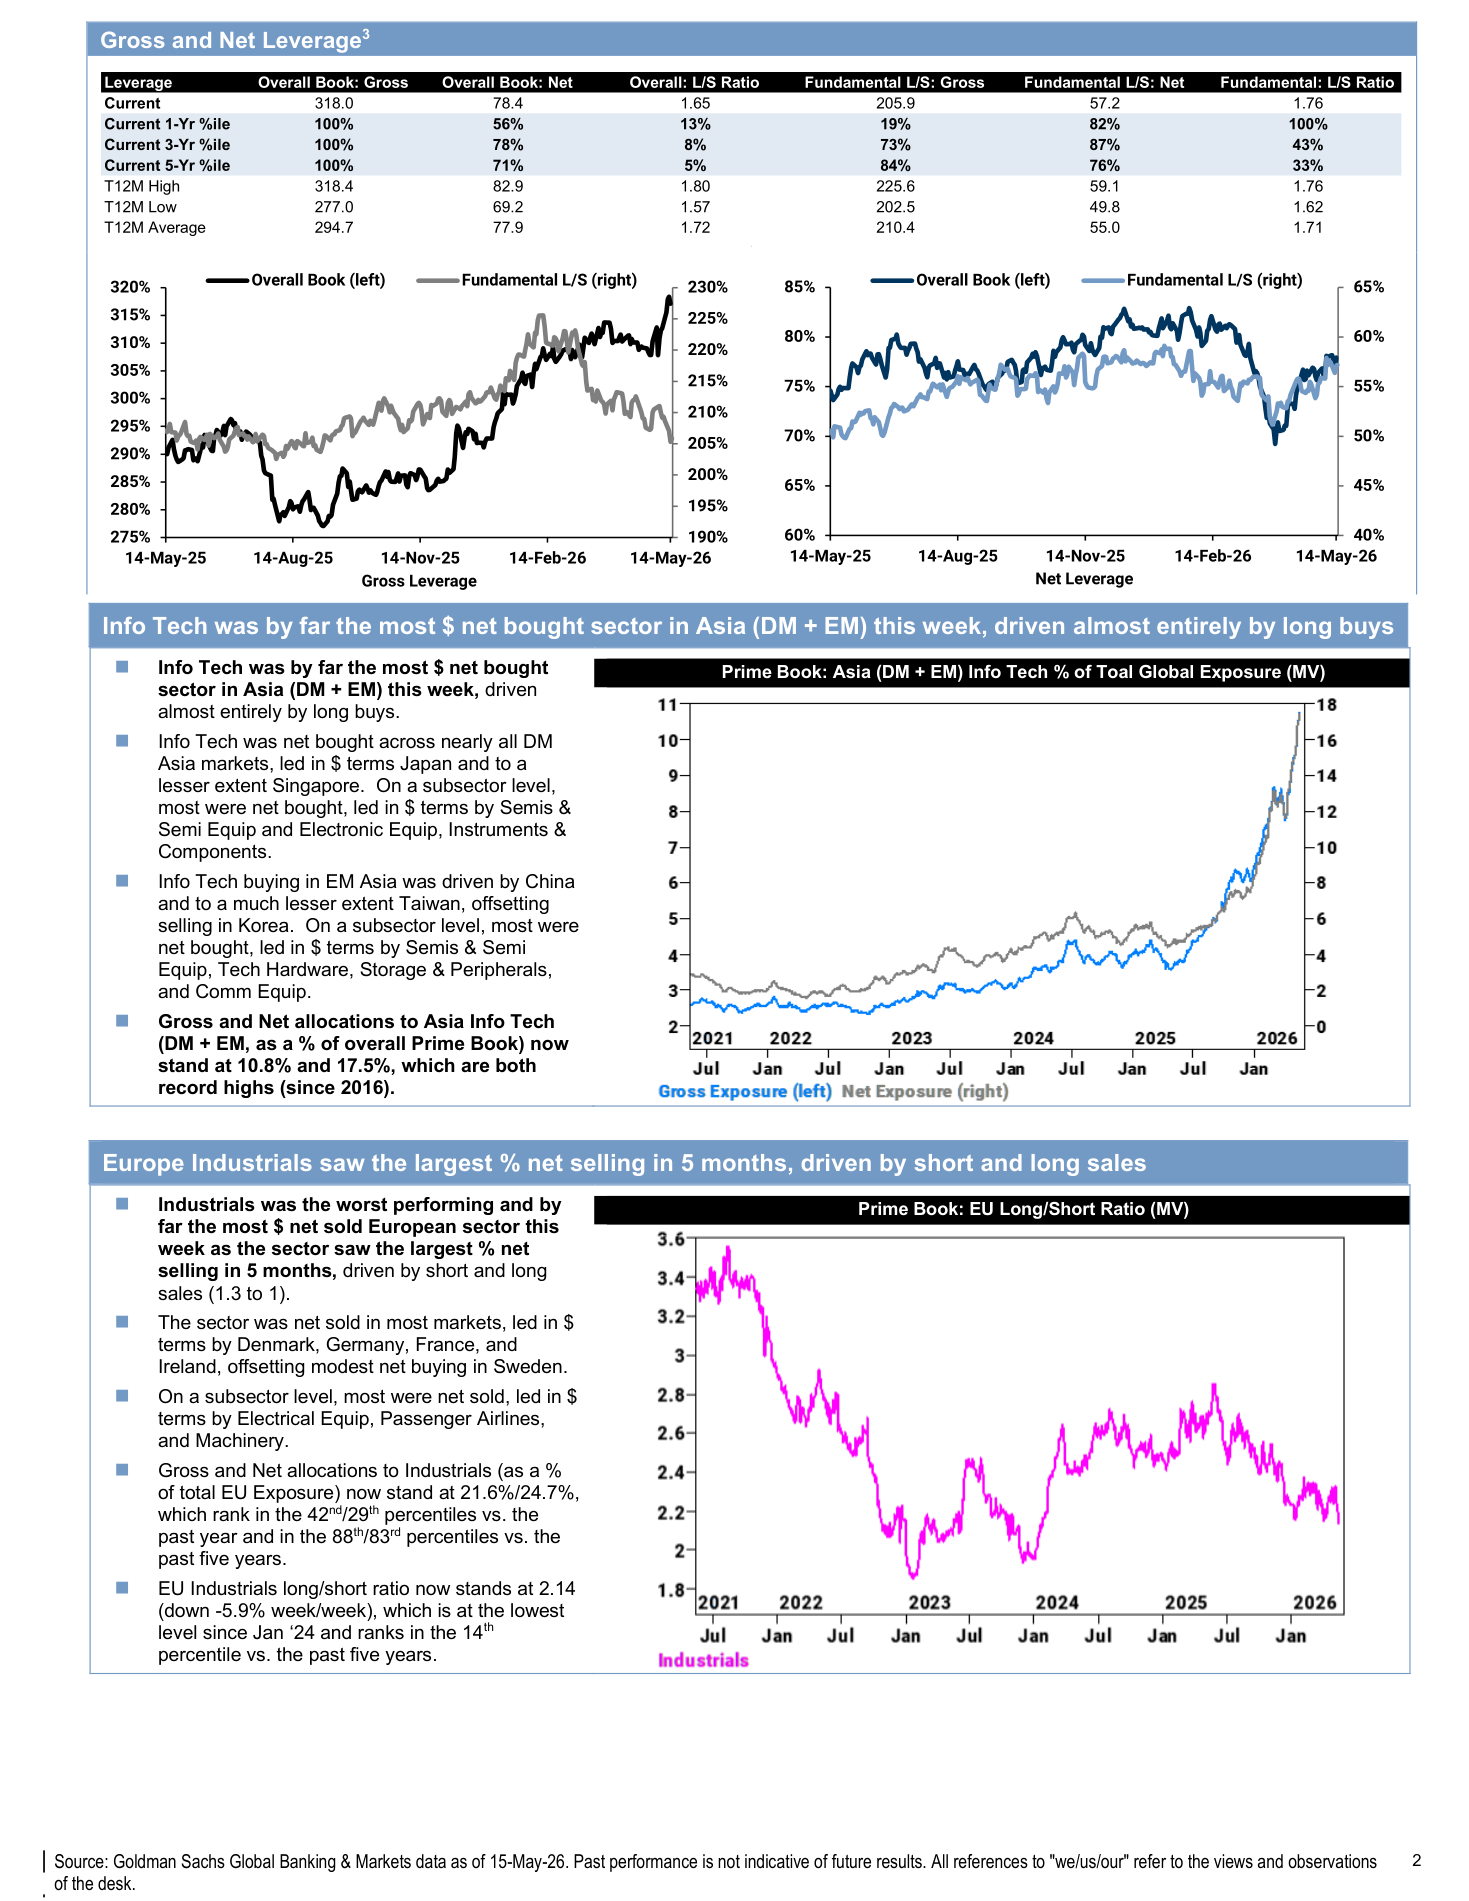
Prime Services Weekly Report 5.15.26
3 additional extracted charts
Chart 1
Page 1 | page-fallback | score 0.775
Chart 2
Page 2 | page-fallback | score 0.662
Chart 3
Page 3 | vector-cluster | score 0.668
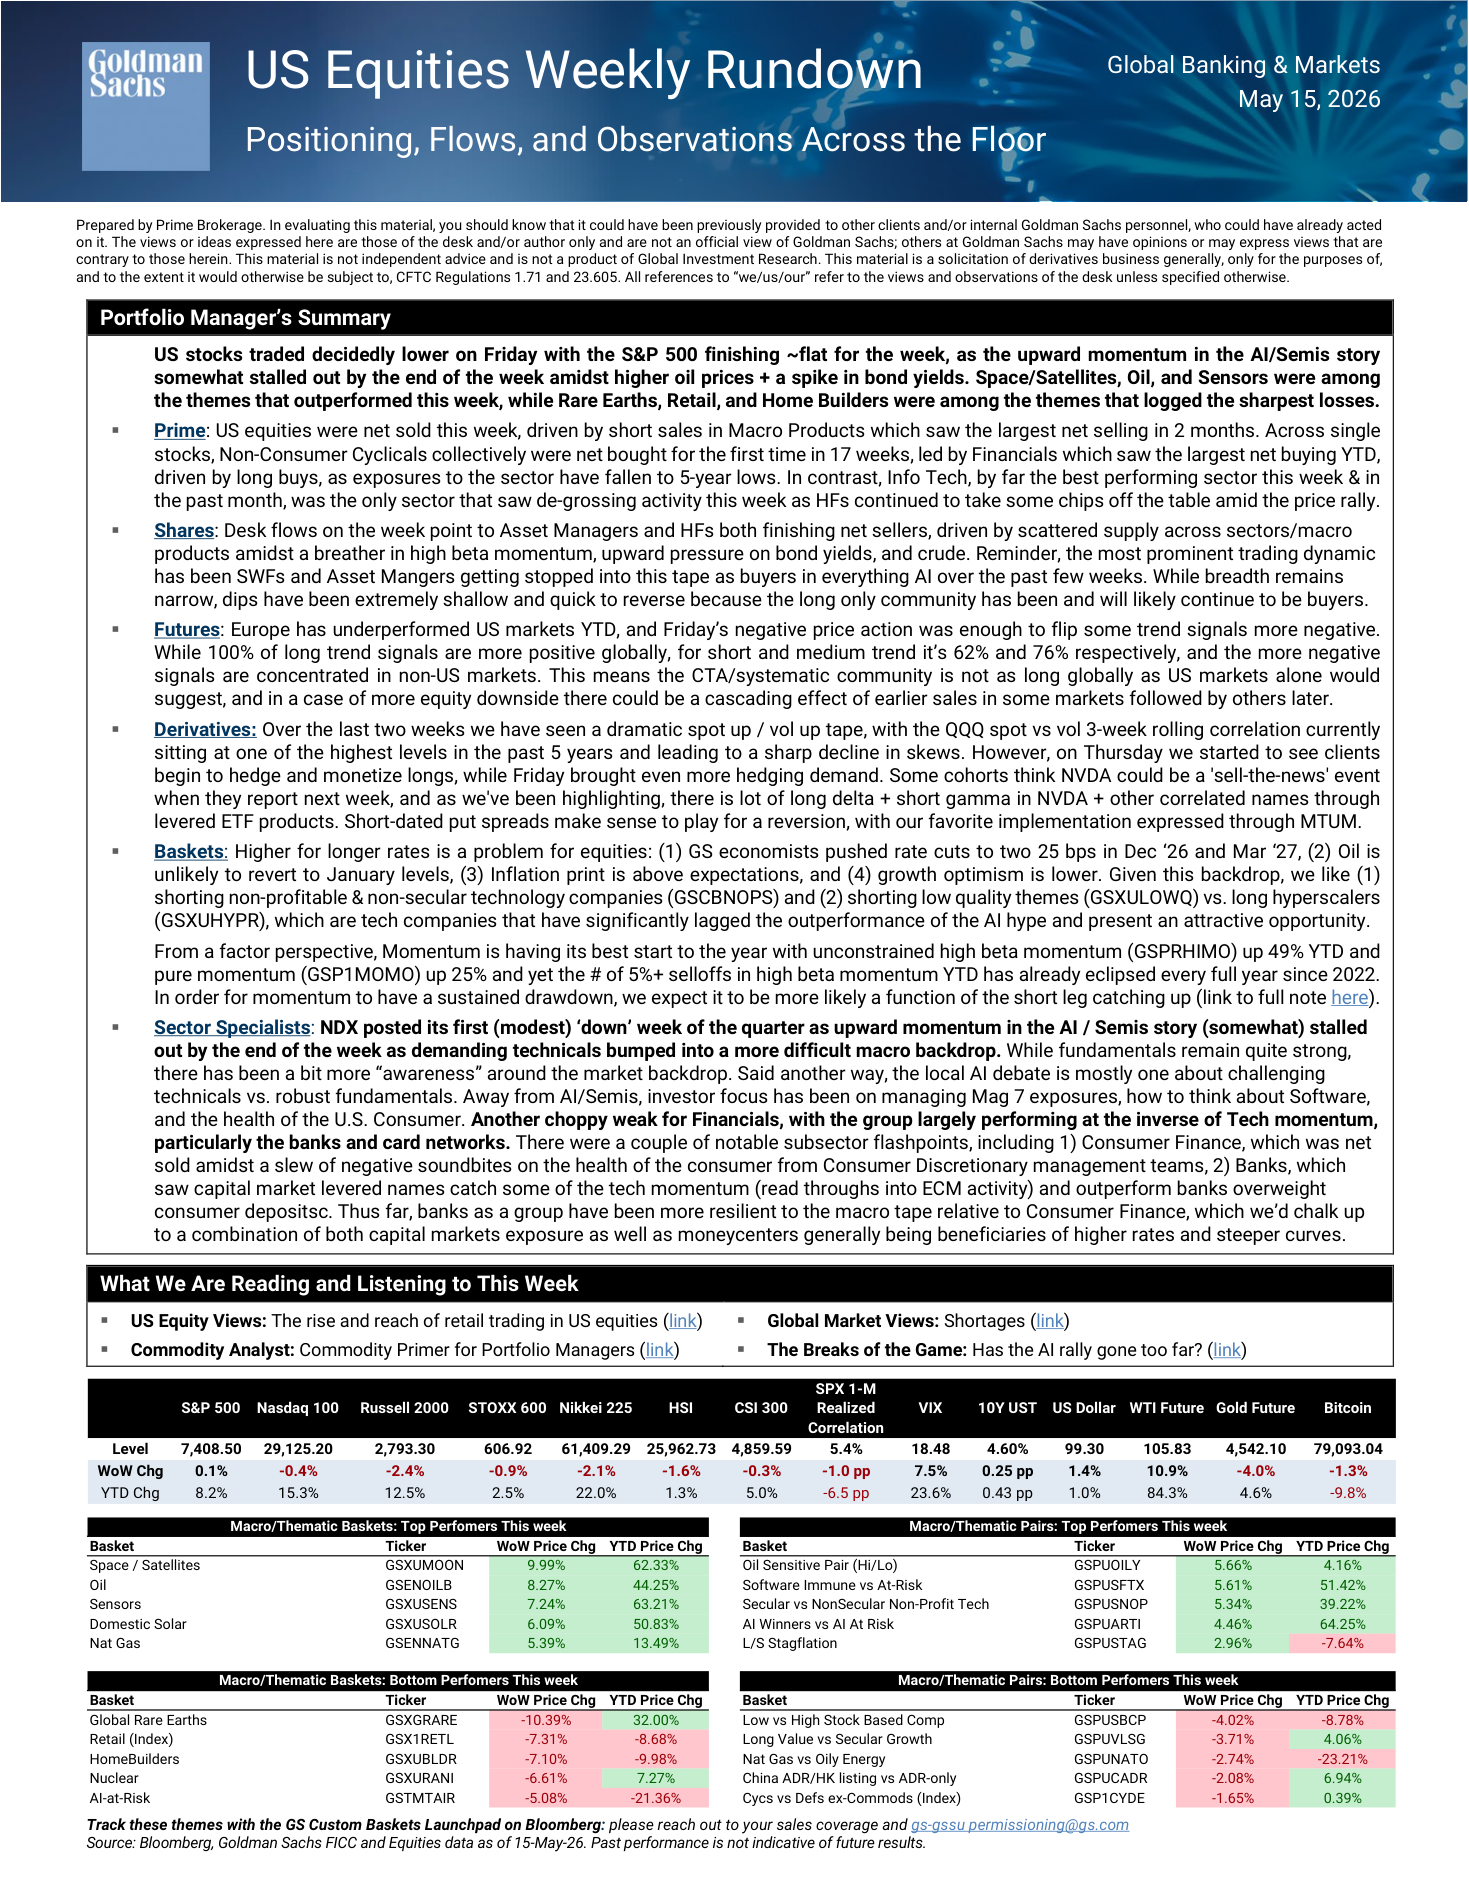
US Equities Weekly Rundown 5-15-26
3 additional extracted charts
Chart 1
Page 1 | page-fallback | score 1.000
Chart 2
Page 10 | image-block | score 0.694
Chart 3
Page 12 | image-block | score 0.732
BofA Systematic Flows Monitor Systematic flows stabilize as equity
2 additional extracted charts
Chart 1
Page 5 | vector-cluster | score 0.927
Chart 2
Page 14 | page-fallback | score 1.000
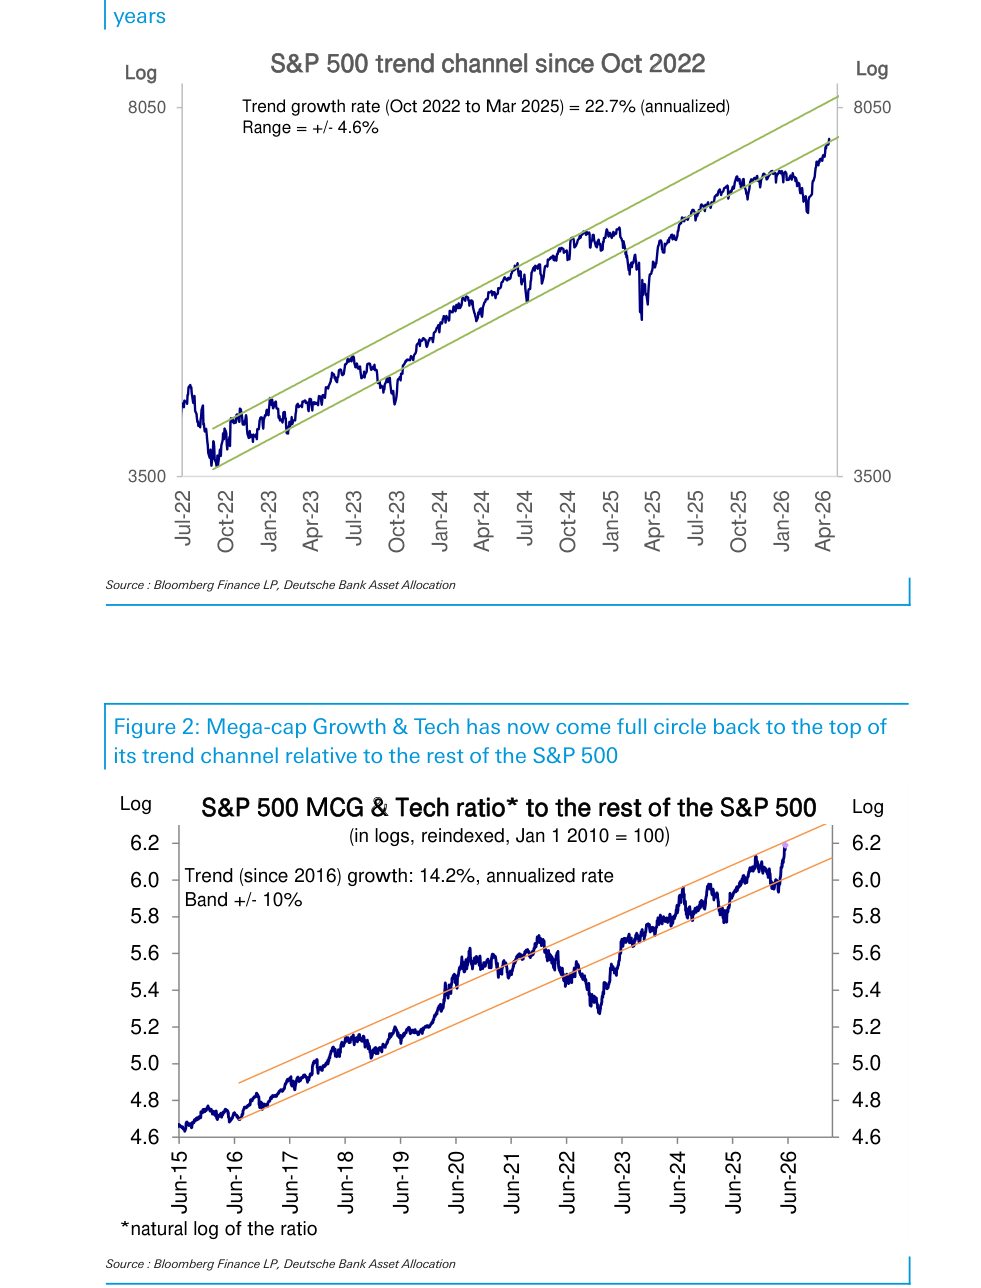
DB Investor Positioning and Flows Tech Comes Full Circle 20260515
3 additional extracted charts
Chart 1
Page 2 | vector-cluster | score 1.025
Chart 2
Page 11 | page-fallback | score 1.000
Chart 3
Page 11 | vector-cluster | score 0.975
JPM The J P Morgan View Higher for Longer in Oil and Rates Own AI